Brian, thought I'd provide this to see if you wanted it for a future update.
I've updated the AQI chart display to colour each data point in the chart according to the AQI
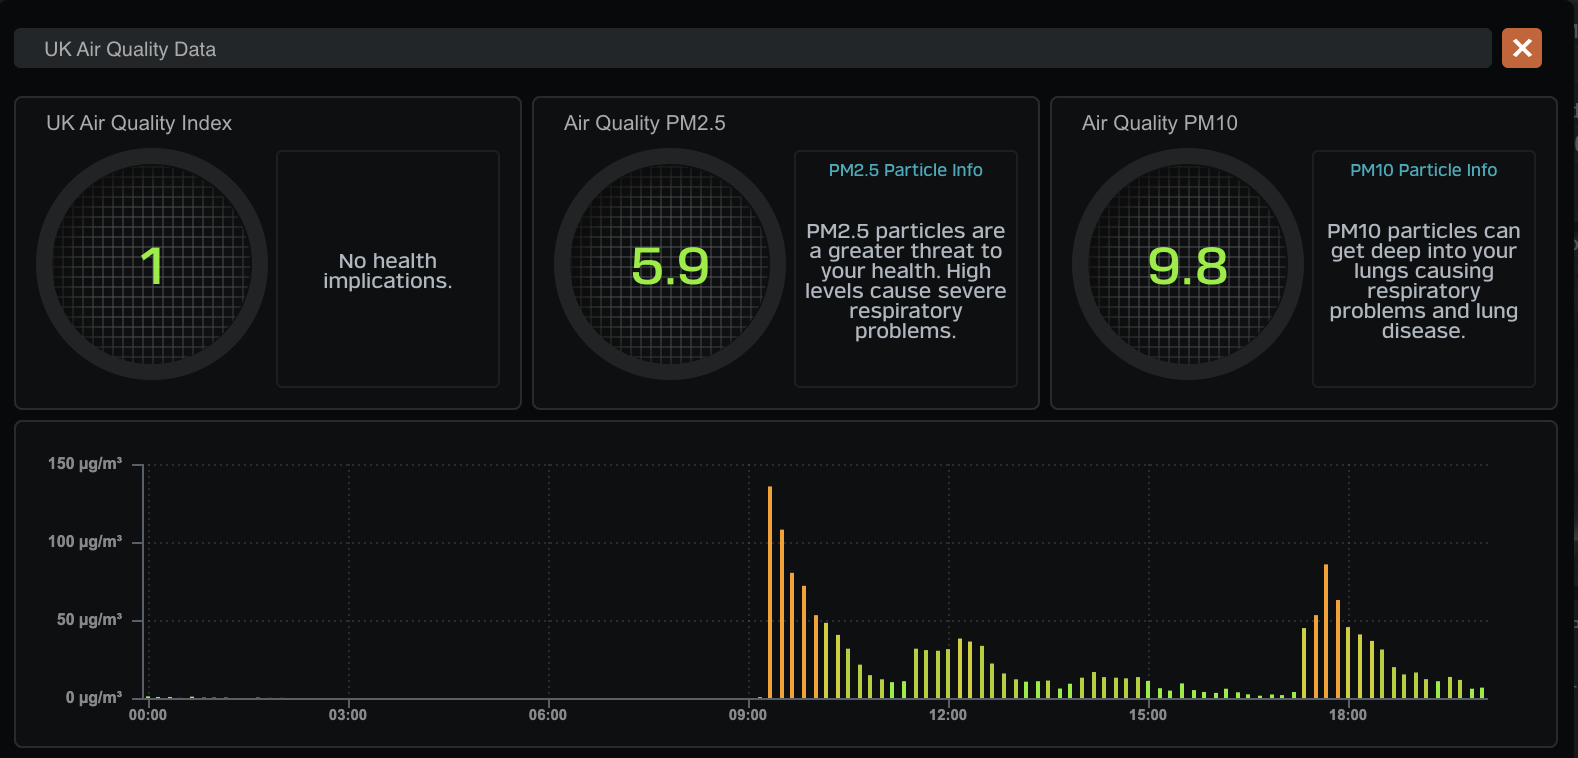
- Screenshot 2020-10-27 at 27 October 2020 20.06.41 pm.png (177.96 KiB) Viewed 7297 times
I added a chunk of function code to
todayairqualitychart.php to assign (my UK) AQI colours to each datapoint based on the AQI value.
Code: Select all
        function ColorPM25(a) {
                if (a>=0 && a<=50) {ColorCalc='#80f000';}
                else if (a>50 && a<=100) {ColorCalc='#b0d000';}
                else if (a>100 && a<=150) {ColorCalc='#d0d000';}
                else if (a>150 && a<=200) {ColorCalc='#ffa000';}
                else if (a>200 && a<=300) {ColorCalc='#ff7000';}
                else if (a>300 && a<=400) {ColorCalc='#ff3000';}
                else if (a>400 && a<=500) {ColorCalc='#703232';}
                else {ColorCalc='#444444';}
                return ColorCalc;
        }
then modified the
datapoints1.push and
datapoints2.push statements to add the colour to each datapoint:
Code: Select all
dataPoints1.push({label: rowData[1],y:parseFloat(rowData[18]),color:ColorPM25(parseFloat(rowData[18]))});
I then remove the
color:'<?php echo $tempcolor?>', statement from the
data: section.
Call it an atonement for bugging you about AQI.
Ps. Ignore the fact that I convert the data to use PM2.5 values rather than AQI for my table. The code will work with the original AQI plotting.


