Page 2 of 2
Re: Define Charts from the GUI
Posted: Sun Jan 10, 2021 2:40 pm
by andlil
Yes, the data is there but I find it easier visually to see the rainstorms since the bars are relative in size to each other as opposed to the top graph where the scale keeps shrinking with the accumulation of rain. Look how quickly you can spot the heavy rainstorm in the second chart.
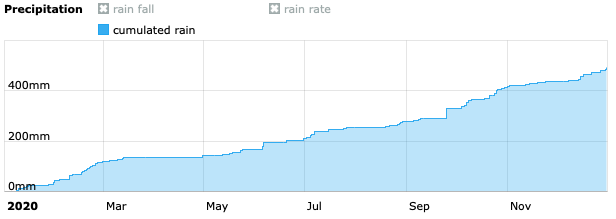
- Skärmavbild 2021-01-10 kl. 13.36.10.png (13.78 KiB) Viewed 5538 times
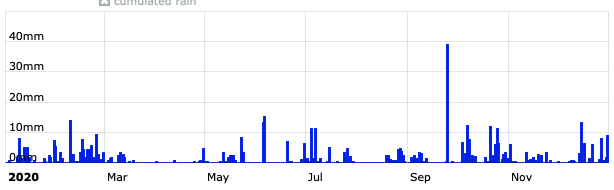
- Skärmavbild 2021-01-10 kl. 13.36.35.png (12.75 KiB) Viewed 5538 times
Re: Define Charts from the GUI
Posted: Sun Jan 10, 2021 5:02 pm
by admin
Just released update should do the job.
- Bildschirmfoto 2021-01-10 um 15.59.34.png (15.76 KiB) Viewed 5530 times
Re: Define Charts from the GUI
Posted: Sun Jan 10, 2021 7:20 pm
by grwkak
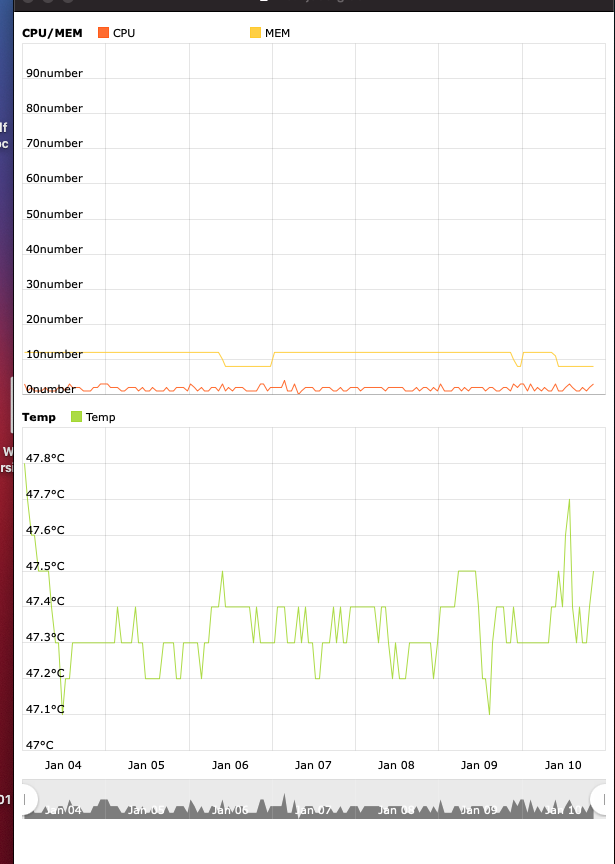
Liking this functionality a lot. One issue I have come across - I did have a plot of CPU temperature - looks like that has been renamed as CPU T #9 from t9temp but is not available as an option in the sensor dropdown. using t9temp returns a blank plot.
Guy
Re: Define Charts from the GUI
Posted: Sun Jan 10, 2021 9:53 pm
by andlil
I am very happy with todays updates!
grwkak wrote: Sun Jan 10, 2021 7:20 pm
using t9temp returns a blank plot.
Mine returns the temperature but, sure, the naming needs some cleaning up.
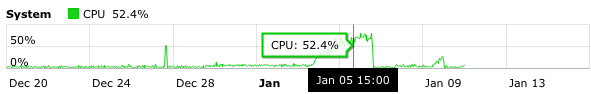
Also, most of the system stats lacks unit and is currently "number"
- Skärmavbild 2021-01-10 kl. 20.48.53.png (90.96 KiB) Viewed 5512 times
Re: Define Charts from the GUI
Posted: Sun Jan 10, 2021 10:37 pm
by grwkak
Seems to be related to the use of panels. Processor temp was set as invisible when I edited the template after updating. Now it displays.
Guy
Re: Define Charts from the GUI
Posted: Mon Jan 11, 2021 12:22 am
by admin
"number" issue should be fixed with just released update. You can now insert an individual unit descriptor to be used in the chart. This is simply done by adding it in square brackets after the sensor name. Example "CPU[%]" gives the sensor the name "CPU" and uses "%" as unit for displaying. This might help to give the system data better naming without having me to invent all kind of unit strings. This can also be used to override unit strings of any sensor. Please be aware that this is just a renaming. Data conversion like from °C to °F is done based on the units you select in the drop down.

- Bildschirmfoto 2021-01-10 um 23.15.10.png (8.55 KiB) Viewed 5500 times
- Bildschirmfoto 2021-01-10 um 23.23.49.png (17.95 KiB) Viewed 5500 times
Re: Define Charts from the GUI
Posted: Mon Jan 11, 2021 4:45 pm
by galfert
I was glad that the RPI option had newly become available. That alone was a welcome upgrade to the TP-Link. But now all this incredible new development with new features improvements, and it's like a double extra awesomeness.
Re: Define Charts from the GUI
Posted: Mon Aug 09, 2021 11:35 pm
by heinz_nt
Hi,
it's a great tool. In the tab "generate graphs" for evapotranspiration can't choosen a unit and a period similar to rain0rate and rain0total. At the moment it doesn't makes much sense. Could this be fixed please?
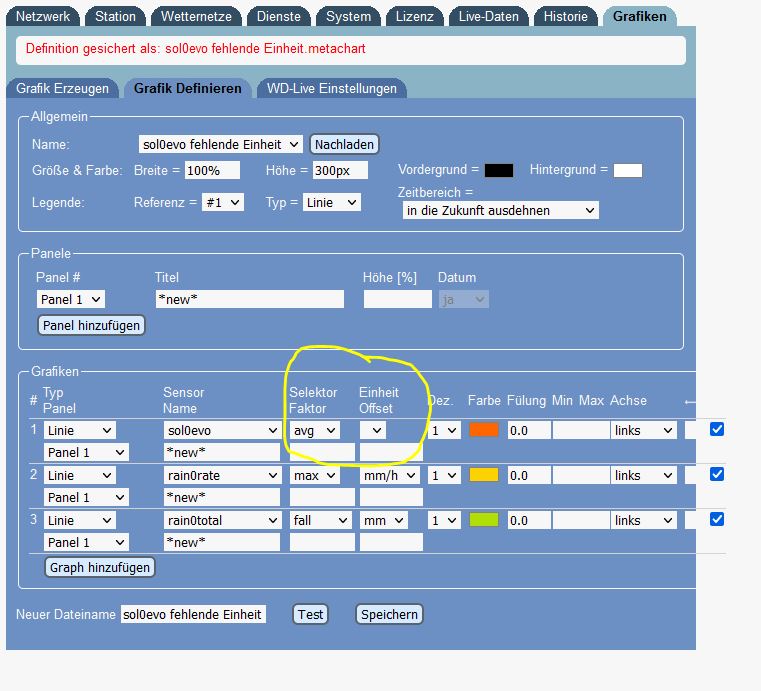
- sol0evo_example.JPG (97.63 KiB) Viewed 4793 times
Another point: would it be possible to integrate in the tab "generate chart" a more flexibel opportunity to define time period similar as in the tab "history _ edit hour data" ? With this it would be much easier to generate for example a graph for a certain month of a year.
Re: Define Charts from the GUI
Posted: Tue Aug 10, 2021 12:08 am
by admin
Just released an update which might fix your sol#evo issue.
As time frame and resolution of a graph is easily controlled via URL paramaters I do not provide fancy drop-downs for it.
Re: Define Charts from the GUI
Posted: Thu Sep 02, 2021 10:37 am
by masgio69
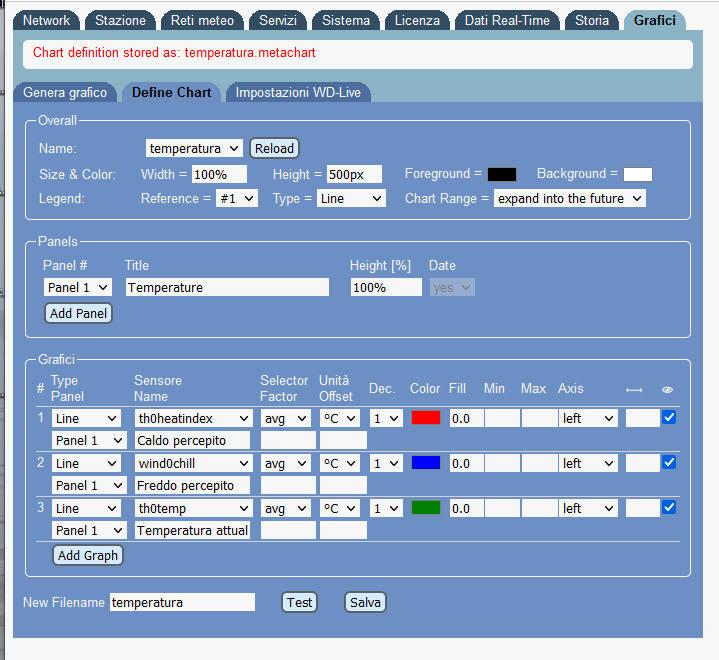
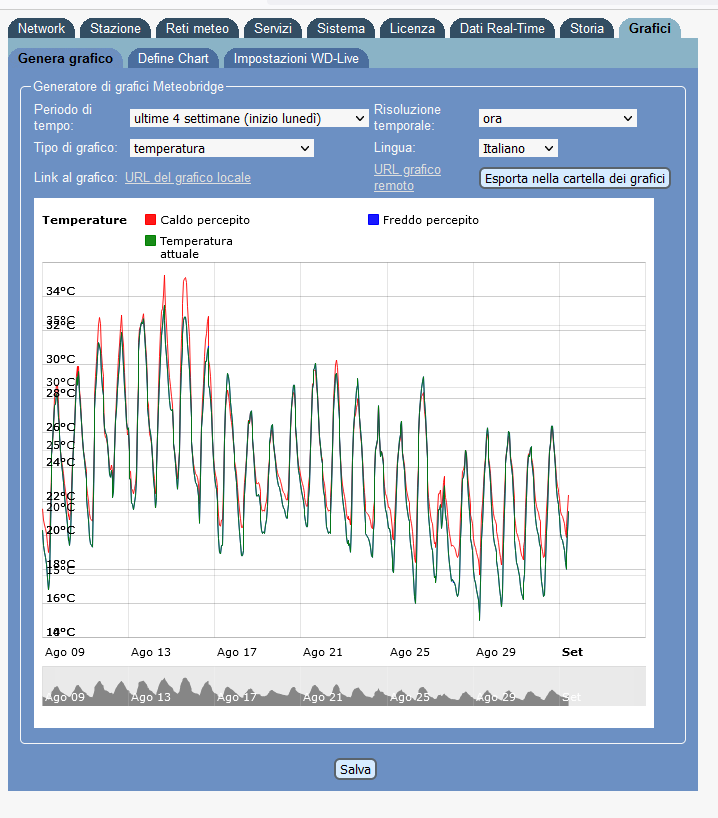
Non riesco ad avere la stessa scala di temperatura in questo grafico che ho creato , dove stò sbagliando?
Grazie per la risposta.
- 01.png (42.6 KiB) Viewed 4722 times
- 02.png (98.81 KiB) Viewed 4722 times
Re: Define Charts from the GUI
Posted: Tue Sep 07, 2021 1:33 pm
by admin
I think the problem is that the 3 graphs do not share the same left axis. Please select "as #1" (or alike, i don't remember right naming) in "Axis" column for definitions 2 and 3
Re: Define Charts from the GUI
Posted: Tue Sep 07, 2021 5:39 pm
by masgio69
Thank you very much, it works perfectly as I wanted.
Re: Define Charts from the GUI
Posted: Wed Sep 08, 2021 4:13 pm
by masgio69
Another question if it is possible, I would like to create a graph relating to the annual rainfall in the column relating to the last years, but as a maximum export time I have only 2 years and not all the data period that I have above the mb, about 10 years. I am attaching 2 images to clarify better .........
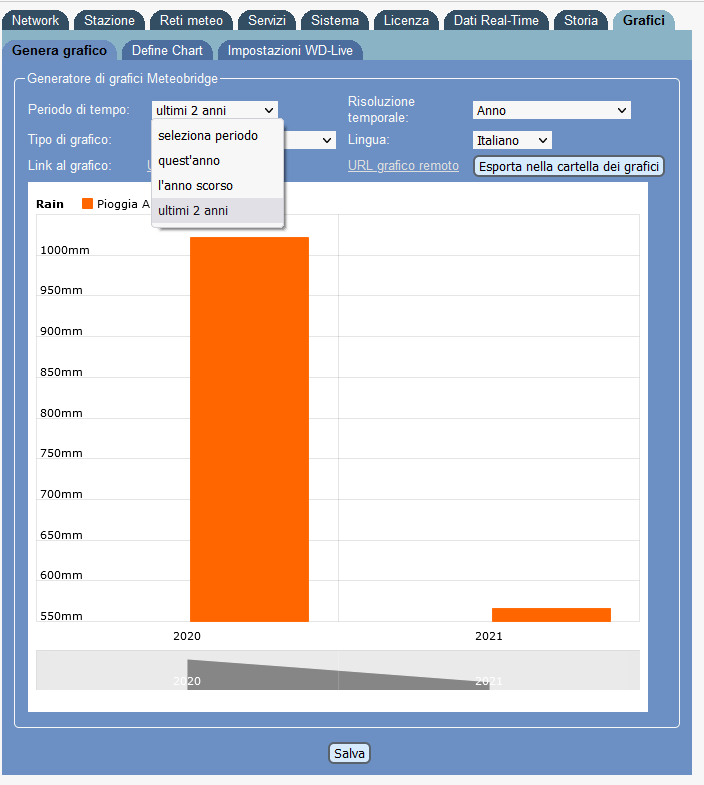
- 2021-09-06 02.png (29.43 KiB) Viewed 4655 times
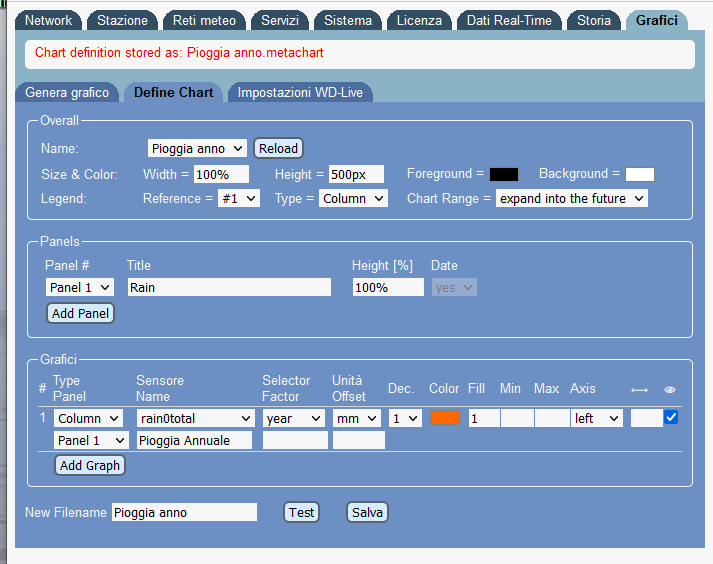
- 2021-09-06 01.png (36.13 KiB) Viewed 4655 times
Re: Define Charts from the GUI
Posted: Thu Sep 09, 2021 9:58 pm
by admin
You can generate the graphs via URL calls. The URL button does this. There you can change the URL parameters to have a timeframe of your liking.
Definition of URL parameters can be found here:
https://meteobridge.com/wiki/index.php/ ... L_selector
Re: Define Charts from the GUI
Posted: Fri Sep 10, 2021 9:26 am
by masgio69
Thank you so much!!!