Page 1 of 2
Define Charts from the GUI
Posted: Thu Jan 07, 2021 6:02 pm
by admin
Just released version allows to define charts from the GUI. Feature can be found on tab "Graphs - Define Charts" and is still experimental. I am rather sure that there are still bugs in there. Please report findings in this thread.
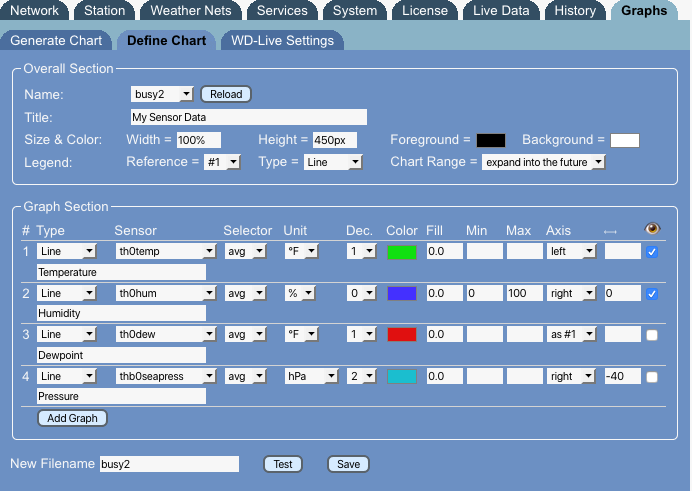
- Bildschirmfoto 2021-01-07 um 16.58.00.png (72.79 KiB) Viewed 8220 times
Explanation of settings can be found in metachart definition here:
https://www.meteobridge.com/wiki/index. ... Definition
Re: Define Charts from the GUI
Posted: Fri Jan 08, 2021 8:04 am
by paul_1055
Great job!
2 things caught my eye
1. Spelling mistake in foreground
2. When selecting the 'min' selector, it always goes back to 'max'
- meteobridge51.JPG (126.43 KiB) Viewed 8196 times
Re: Define Charts from the GUI
Posted: Fri Jan 08, 2021 10:25 am
by admin
Thanks. Fixed with just released update.
Re: Define Charts from the GUI
Posted: Fri Jan 08, 2021 12:19 pm
by mthiessen
Great new feature. Thank you.
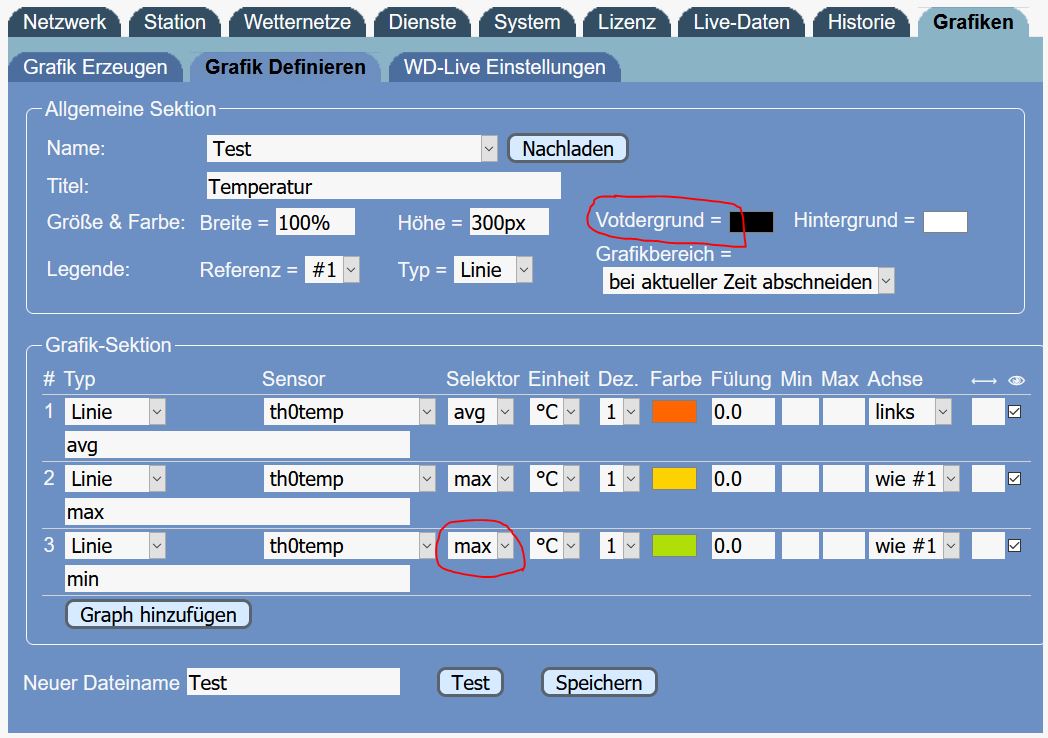
The language doesn't show as English even if "English" is selected.
- Meteobridge screenshot German.png (290.65 KiB) Viewed 8172 times
Re: Define Charts from the GUI
Posted: Fri Jan 08, 2021 12:24 pm
by admin
It does not automatically convert your texts. The language selector is about texts you don't type in yourself like date/time formats, name of months, week days, etc.
Re: Define Charts from the GUI
Posted: Sat Jan 09, 2021 5:28 pm
by Gyvate
paul_1055 wrote: Fri Jan 08, 2021 8:04 am
Great job!
2 things caught my eye
1. Spelling mistake in foreground
2. When selecting the 'min' selector, it always goes back to 'max'
meteobridge51.JPG
not sure if this already caught the developer's eye: the German version of "Fill" is either "füllen" oder "Füllung" - in both cases with two "l"

In the picture above it's still with one "l" only - it's a beauty thing though
Re: Define Charts from the GUI
Posted: Sat Jan 09, 2021 6:57 pm
by mthiessen
admin wrote: Fri Jan 08, 2021 12:24 pm
It does not automatically convert your texts. The language selector is about texts you don't type in yourself like date/time formats, name of months, week days, etc.
I'm afraid I don't quite understand. How do I change labels like "Termperatur" and "Luftfeuchte" to English?
Re: Define Charts from the GUI
Posted: Sat Jan 09, 2021 11:56 pm
by admin
mthiessen wrote: Sat Jan 09, 2021 6:57 pm
admin wrote: Fri Jan 08, 2021 12:24 pm
It does not automatically convert your texts. The language selector is about texts you don't type in yourself like date/time formats, name of months, week days, etc.
I'm afraid I don't quite understand. How do I change labels like "Termperatur" and "Luftfeuchte" to English?
You change it in the definition of the chart "test". Can we please come back to the topic which is about defining charts on "Graphs - Define Charts" tab?
Re: Define Charts from the GUI
Posted: Sun Jan 10, 2021 12:00 am
by admin
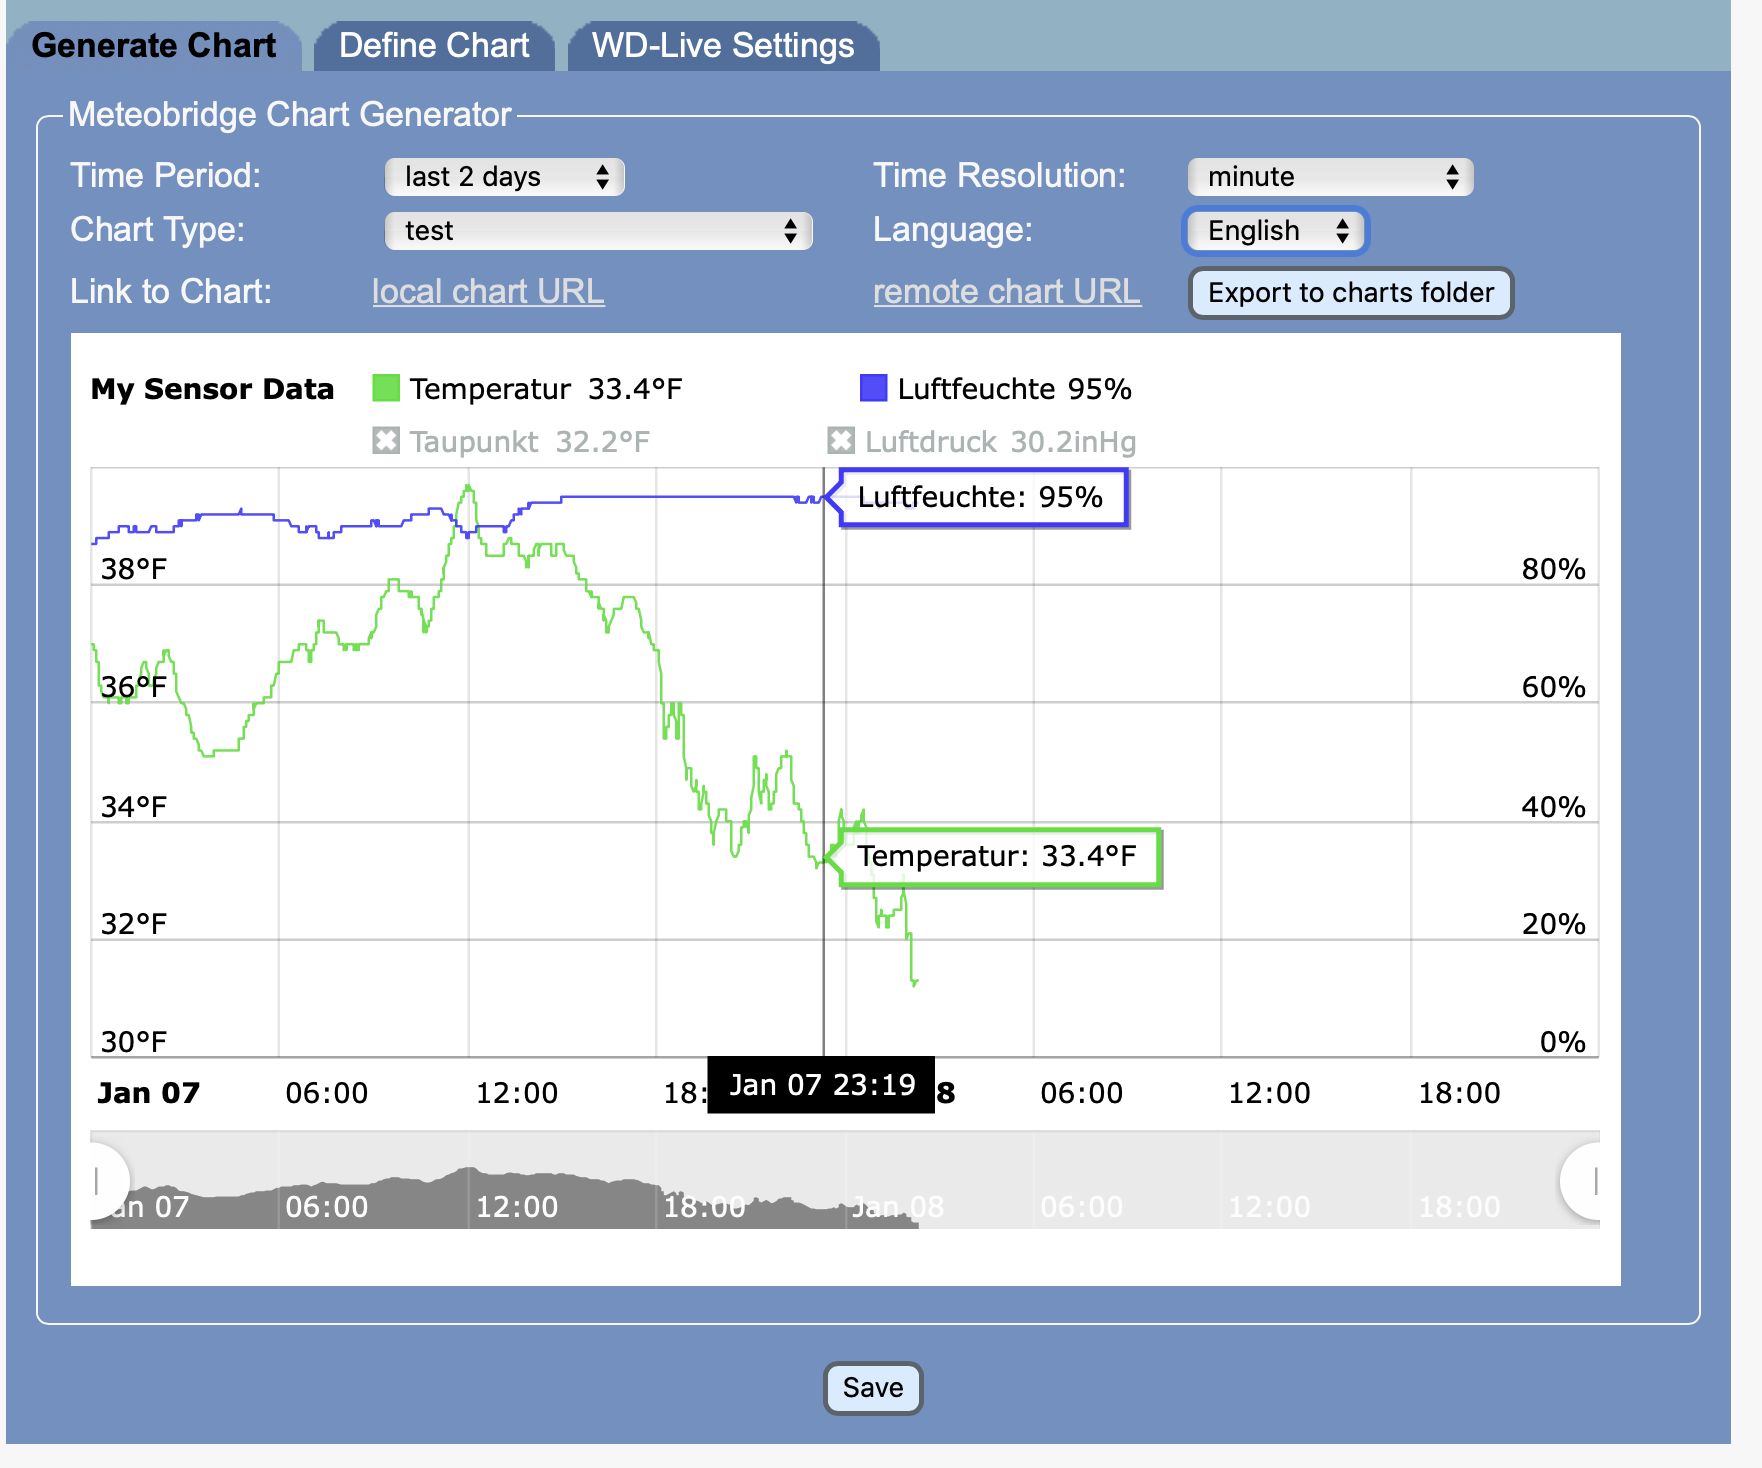
Just released features allows to define multi-panel charts like the predefined "all-in-one" charts.
Example Definition:
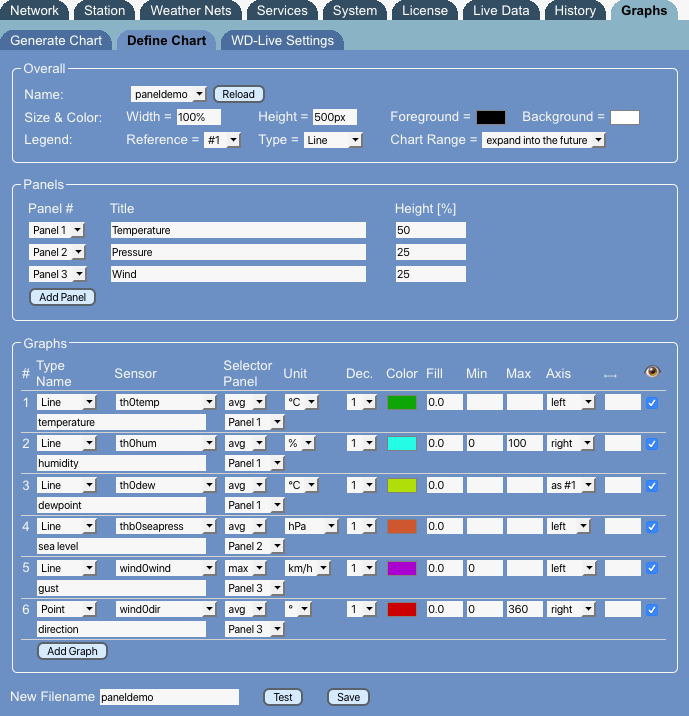
- Bildschirmfoto 2021-01-09 um 23.14.27.png (96.24 KiB) Viewed 8038 times
Resulting chart (evaluated with resolution "min" for last 24 hours):
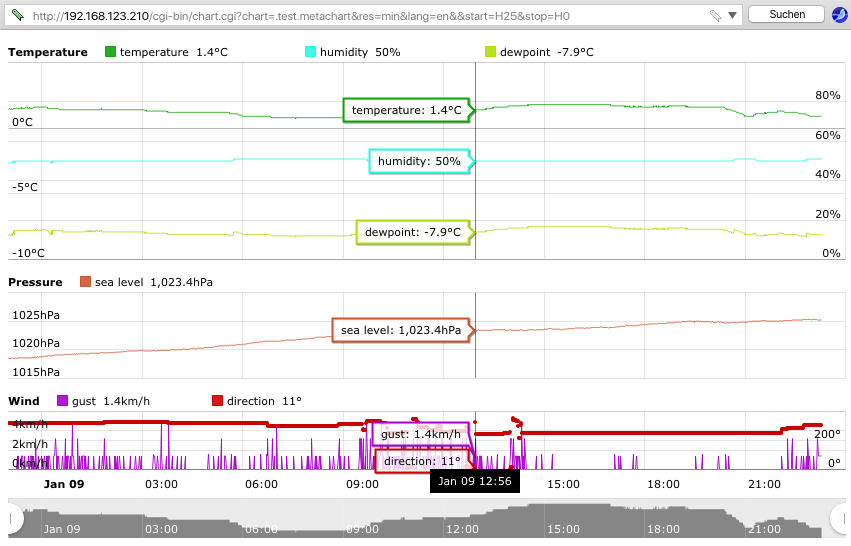
- Bildschirmfoto 2021-01-09 um 23.13.04.png (85.77 KiB) Viewed 8039 times
Re: Define Charts from the GUI
Posted: Sun Jan 10, 2021 10:42 am
by andlil
Thank you for this sudden burst of features but my uptime is really suffering from all these updates
Re: Define Charts from the GUI
Posted: Sun Jan 10, 2021 11:36 am
by andlil
Could you make it possible to get the time axis selectable on each panel? Right now I have 4 panels and the time axis is at the very bottom of the entire graph.
//A
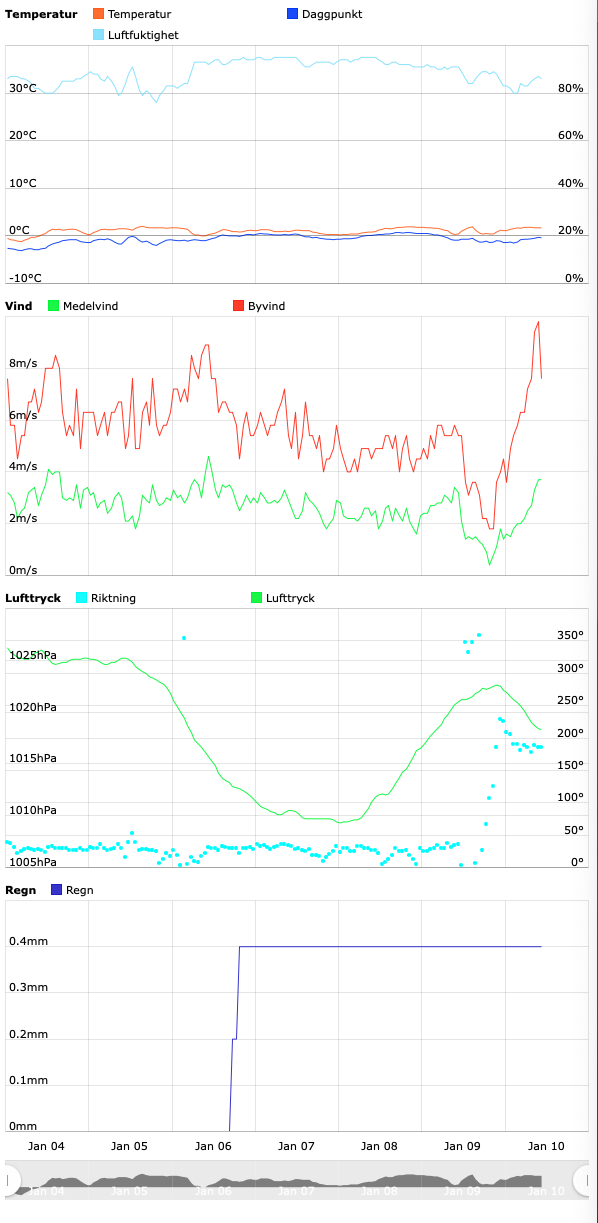
- Skärmavbild 2021-01-10 kl. 10.15.30.png (145.9 KiB) Viewed 8009 times
Re: Define Charts from the GUI
Posted: Sun Jan 10, 2021 12:08 pm
by admin
andlil wrote: Sun Jan 10, 2021 10:42 am
Thank you for this sudden burst of features but my uptime is really suffering from all these updates
The new graphing options should not interfere with data logging as I did not touch there anything. However, when you are interested into the new features and their further development, a few more reboots might come ahead.

Re: Define Charts from the GUI
Posted: Sun Jan 10, 2021 1:14 pm
by admin
andlil wrote: Sun Jan 10, 2021 11:36 am
Could you make it possible to get the time axis selectable on each panel? Right now I have 4 panels and the time axis is at the very bottom of the entire graph.
Just released update allows to define per panel if the date&time data is shown on X-axis via "Date" selector. Last panel does always show date&time data.
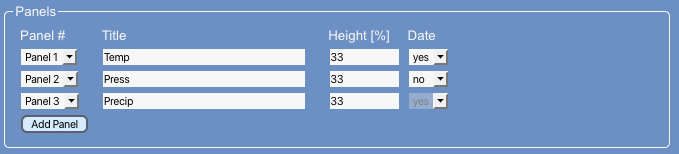
- Bildschirmfoto 2021-01-10 um 12.13.45.png (17.03 KiB) Viewed 7999 times
Re: Define Charts from the GUI
Posted: Sun Jan 10, 2021 1:52 pm
by andlil
I'll gladly reboot if this is to continue.
Is it possible to get cardinals (NWSE) as a compliment to degrees in wind direction?
I actually really like the allinone-wind1st chart but I see no way of recreating the rain graph (the blue ticks at the bottom) in the new GUI, I can only choose rain0total and rain0rate, I think rainfall and cumulated rain would be interesting.
Re: Define Charts from the GUI
Posted: Sun Jan 10, 2021 2:19 pm
by admin
rain0total is accumulated rain. Doesn't it delver the expected result?