Page 1 of 1
MB PRO: How hot is too hot?
Posted: Sun Oct 24, 2021 12:16 pm
by admin
Although consuming only up to 2.5 Watts the Meteobridge PRO can heat up, especially when located somewhere not providing good air circulation. Today I run a small test by giving a MB PRO a test drive on my PCB preheating device. The Meteobridge did pretty well. Even when internal reading on the base board (thb9temp) went to 80°C it was still operating flawless, including WLAN, RF data reception and display. I did not heat up more, because 80°C is far beyond reasonable limits and a value hard to reach when you don't put it on a heating plate and I was not keen to damage the unit.
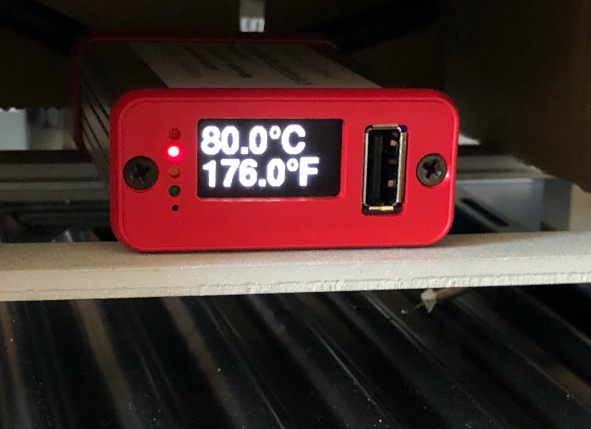
- heat1.jpg (52.44 KiB) Viewed 1609 times
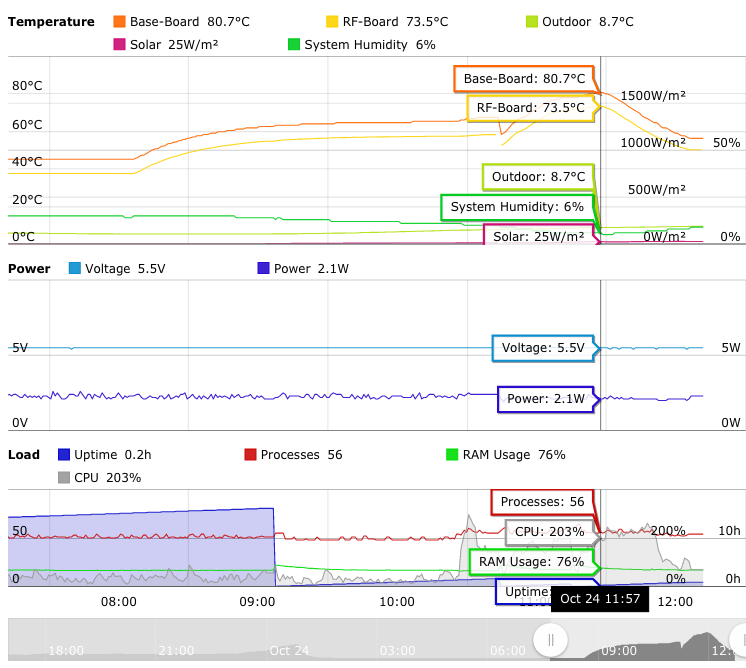
What I take away from this is, that while you should drive the Meteobridge PRO internal base board temp below 60°C to reduce wear of the components, it can at least stand 80°C for a shorter period of time.
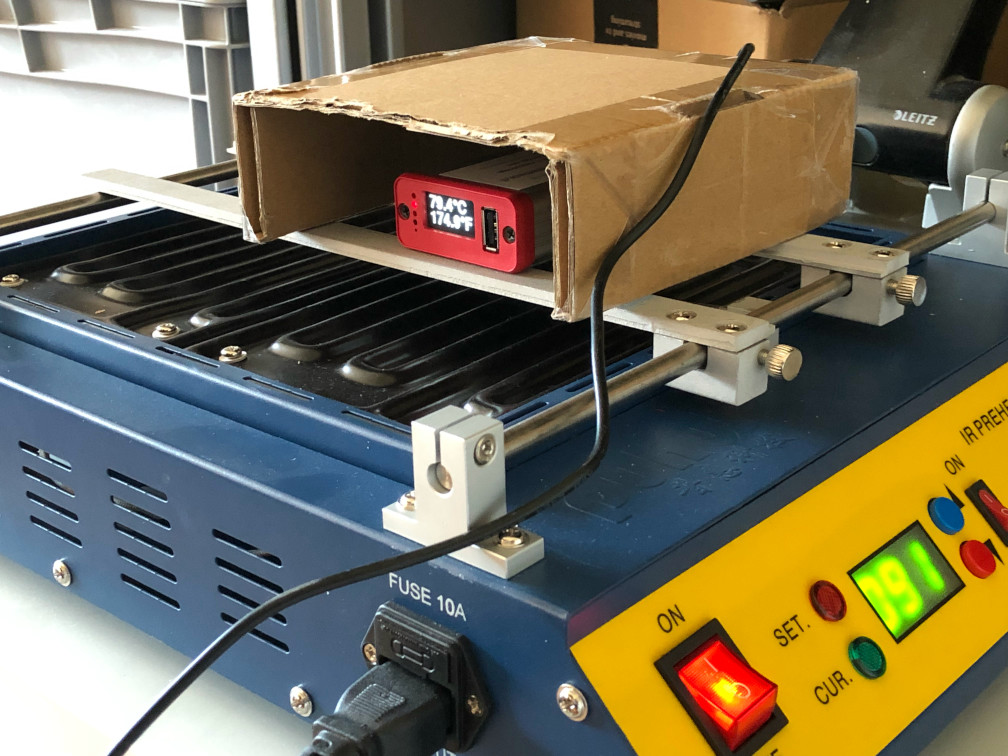
- heat2.jpg (215.89 KiB) Viewed 1609 times
Re: MB PRO: How hot is too hot?
Posted: Sun Oct 24, 2021 12:41 pm
by admin
In case you also want to inspect some system data on your Meteobridge PRO the newly defined Metachart "MBPRO-health" might be useful.
- Bildschirmfoto 2021-10-24 um 12.39.00.png (110.04 KiB) Viewed 1606 times
Re: MB PRO: How hot is too hot?
Posted: Sun Sep 24, 2023 2:31 am
by Mattk
MBPro Health chart doesn't appear to be an option on MBPro2 or NANO/SD but shows up on a MBPRO, Has anybody tried MBPRO Health chart on the PRO2 or NANO?
Re: MB PRO: How hot is too hot?
Posted: Sun Oct 01, 2023 8:50 am
by admin
I will add for PRO2. For NANO much of the data in the chart is not available (RF reception, power consumption) so the chart would be rather empty. As it is a metachart, everybody can generate by themselves anyway. Please see the metachart definition below.
Code: Select all
# generated by meteobridge version 5.3
# date: 2022-03-15 07:35
#
width 100%
height 800px
fgcolor #000000
bgcolor #ffffff
legend 1
type0 line
futuredata yes
title1 Temperature
height1 30
datetime1 no
title2 Power
height2 25
datetime2 no
title3 Load
height3 25
datetime3 no
title4 RF
height4 20
type1 line
unit1 °C
color1 #ff6600
fill1 0.0
axis1 left
active1 yes
panel1 1
name1 Base-Board
type2 line
unit2 °C
color2 #fcd202
fill2 0.0
axis2 axis1
active2 yes
panel2 1
name2 RF-Board
type3 line
unit3 °C
color3 #b0de09
fill3 0.0
axis3 axis1
active3 yes
panel3 1
name3 Outdoor
type4 line
color4 #0d8ecf
fill4 0.0
min4 0
max4 8
axis4 left
active4 yes
panel4 2
name4 Voltage[V]
type5 line
color5 #2a0cd0
fill5 0.0
min5 0
max5 8
axis5 right
active5 yes
panel5 2
name5 Power[W]
type6 line
unit6 W/m²
color6 #cd0d74
fill6 0.0
min6 0
max6 2000
axis6 right
offset6 -50
active6 yes
panel6 1
name6 Solar
type7 line
unit7 %
color7 #00cc21
fill7 0.0
min7 0
max7 100
axis7 right
active7 yes
panel7 1
name7 System Humidity
type8 line
color8 #0a0dcc
fill8 0.2
min8 0
axis8 right
active8 yes
panel8 3
name8 Uptime[h]
type9 line
color9 #cc0b09
fill9 0.0
min9 0
axis9 left
active9 yes
panel9 3
name9 Processes
type10 line
color10 #00dd05
fill10 0.0
min10 0
max10 100
axis10 right
offset10 -50
active10 yes
panel10 3
name10 RAM Usage[%]
type11 line
color11 #999999
fill11 0.2
min11 0
axis11 left
active11 yes
panel11 3
name11 CPU[%]
type12 line
unit12 db
color12 #333333
fill12 0.0
axis12 right
active12 yes
panel12 4
name12 TH0 Signal MIN
type13 line
unit13 db
color13 #a30e7b
fill13 0.0
axis13 right
active13 yes
panel13 4
name13 TH0 Signal MAX
type14 step
color14 #1cc7ff
fill14 0.2
min14 0
max14 1
axis14 left
active14 yes
panel14 4
name14 TH0 lowbat
data1 thb9temp-max=C1,00+0,00.1
data2 thb0temp-max=C1,00+0,00.1
data3 th0temp-avg=C1,00+0,00.1
data4 data17num-max=1,00+0,00.1
data5 data14num-max=1,00+0,00.1
data6 sol0!0rad-max=1,00+0,00.1
data7 thb9hum-max=1,00+0,00.1
data8 data11num-max=1,00+0,00.1
data9 data15num-max=1,00+0,00.1
data10 data13num-max=1,00+0,00.1
data11 data0!10num-max=1,00+0,00.1
data12 th0!0signal-min=1,00+0,00.1
data13 th0!0signal-max=1,00+0,00.1
data14 th0!0lowbat-avg=1,00+0,00.1