Page 1 of 1
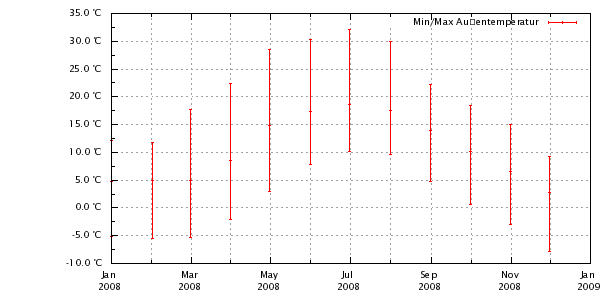
The min-max graph bars not seen in January
Posted: Thu Mar 11, 2010 3:22 pm
by vecerapl
When you create a min-max bars, not seen in January. Other months are already in order.
Can this problem be solved by shifting command in gnuplot? If yes, what is that command?
Min-max bars use to list the temperature. Can a line graph to strengthen - thick line.
This problem is also Boris chart :) is not seen the first month.
Re:The min-max graph bars not seen in January
Posted: Thu Mar 11, 2010 8:43 pm
by marc10k
Hello
When you look at the graph you will see the bars on the left. They are at about -5, 5 and 14. Try to start mid December 2007 instead of 01.01.2008.
Marcus
Re:The min-max graph bars not seen in January
Posted: Thu Mar 11, 2010 8:52 pm
by vecerapl
Hello,
Unfortunately, min / max bars I create automatically for the current year and the current month, doing more saving in the form:
Month: temperature-%m-%Y.png
Year: temperature-%Y.png
Unfortunately meteohub will be on hand, because I am missing here offsets, order in gnuplot, which would be moved inside a graph to the right.

The more I do not understand when I enter the current year, why are there lists and January 2011 :blink:
Re:The min-max graph bars not seen in January
Posted: Fri Mar 12, 2010 11:49 am
by skyewright
vecerapl wrote:Min-max bars use to list the temperature. Can a line graph to strengthen - thick line.
set style line 1 lw 2|set style increment user
Increase the value after
lw to make the line even thicker.
You may find this also reduces the problem of the hard to see first max-min bar.
