Confused about some graph definitions
Posted: Wed May 05, 2010 9:49 pm
Hi,
I'm a little bit confused about some of my graph definitions... or lets say I'm confused about the results...
First, this one http://www.porquesi.de/wetter/7days_out_rain.png
It should show the rain of the last 7 days. But it does not show the rain for the current day, even if it already rained earlier today (upload schedule is "Every Hour" ), it shows nothing, only the rain for the previous days 2-7. Even if data aggregation is "1 day" it should give the data for today, shouldn't it? But it takes until tomorrow, then it shows correctly the rainfall of today :huh:
Then this one here http://www.porquesi.de/wetter/last3monthsmaxmintemp.png
It should show the max/min temp of the previous 5 months, which it does perfectly. Only yesterday is missing, even if the graph has been created at 00:20 today (upload is schedule is "Everyday" )
And las but not least this one: http://www.porquesi.de/wetter/tempdistryearly.png
The timeframe is set to the current year. But even if there is already data available for the first days of May, it takes until June to show the data for May :blink:
...do I miss something obvious here? Or do I need to setup schedule and timeframe differently?
I'm a little bit confused about some of my graph definitions... or lets say I'm confused about the results...
First, this one http://www.porquesi.de/wetter/7days_out_rain.png
It should show the rain of the last 7 days. But it does not show the rain for the current day, even if it already rained earlier today (upload schedule is "Every Hour" ), it shows nothing, only the rain for the previous days 2-7. Even if data aggregation is "1 day" it should give the data for today, shouldn't it? But it takes until tomorrow, then it shows correctly the rainfall of today :huh:
Then this one here http://www.porquesi.de/wetter/last3monthsmaxmintemp.png
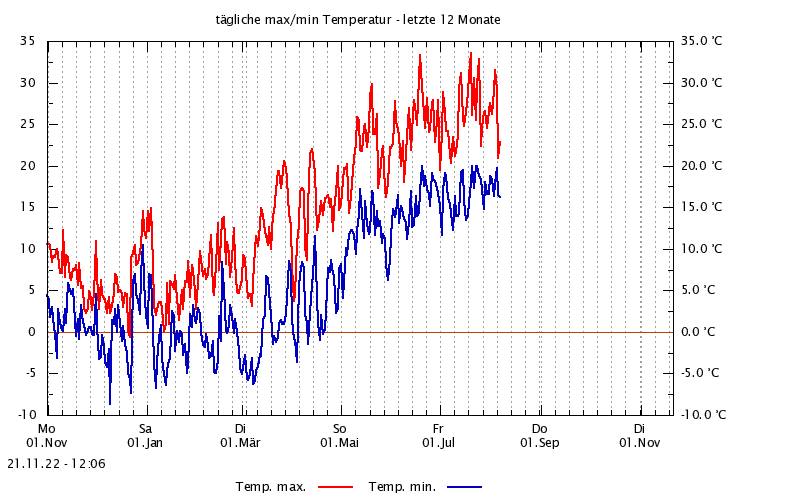
It should show the max/min temp of the previous 5 months, which it does perfectly. Only yesterday is missing, even if the graph has been created at 00:20 today (upload is schedule is "Everyday" )
And las but not least this one: http://www.porquesi.de/wetter/tempdistryearly.png
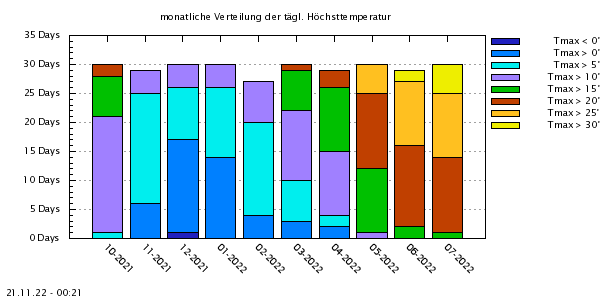
The timeframe is set to the current year. But even if there is already data available for the first days of May, it takes until June to show the data for May :blink:
...do I miss something obvious here? Or do I need to setup schedule and timeframe differently?