
Is this possible or does Boris need to add something?
Having a choice for bgcolor of graphs would aloow a better integration in website which are not based on white background design.
Cheers ...
How can the background color of graphs be changed?
Moderator: Mattk

Re:How can the background color of graphs be changed?
Looking through the GNUPlot manual, it appears that background color is defined at the same level as image-type/terminal (which in our case is locked to the PNG graphic format.) This setting is one level higher than the settings we can customize with the graph format box.
However, there are already a few customizations available to us at this higher level (image dimensions, font size, graph type) so it seems like it would be fairly easy to add an additional drop-down menu with choice of background colors (or maybe even transparency!) for the graphs in a future version.
However, there are already a few customizations available to us at this higher level (image dimensions, font size, graph type) so it seems like it would be fairly easy to add an additional drop-down menu with choice of background colors (or maybe even transparency!) for the graphs in a future version.
-
juergen_h.
- Junior Boarder

- Posts: 25
- Joined: Thu Jul 10, 2008 4:26 pm
Re:How can the background color of graphs be changed?
If you use the following graph format string, you can change the color of background, borders, axes and curve(s):
set terminal png <backgr> <border> <axes> <curve1> <curve2>;
color definition: <xrrggbb>
rr = hex value red
gg = hex value green
bb = hex value blue
Gruss
Jürgen
set terminal png <backgr> <border> <axes> <curve1> <curve2>;
color definition: <xrrggbb>
rr = hex value red
gg = hex value green
bb = hex value blue
Gruss
Jürgen
Re:How can the background color of graphs be changed?
Hi Jürgen and sevenless,
thanks.
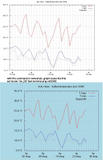
The hint from Jürgen does paint the graphs, but does also override some settings already done with the GUI.
font size for scale and key are enlarged after using the set terminal png command.
Do I have to set this also manually with a format command?
Thanks for the help,
Wolfgang
Here´s a screenshot:
thanks.
The hint from Jürgen does paint the graphs, but does also override some settings already done with the GUI.
font size for scale and key are enlarged after using the set terminal png command.
Do I have to set this also manually with a format command?
Thanks for the help,
Wolfgang
Here´s a screenshot:

Re:How can the background color of graphs be changed?
Interesting that you can tweak higher-level settings like that!
One issue I have run into with custom settings (and maybe this deserves its own thread in the Graph Definitions topic) is there seems to be a limit to the number of custom settings you can enter into the format box. I had a lot of customization on my weekly rain bar graph and discovered that after six custom settings any following ones were ignored.
I'm not sure if it's a limit on the number of 'set' requests, or the length of the string, or some weird issue with GNUplot getting confused due to the default settings and all the overrides, but has anyone else run into this quirk?
-
juergen_h.
- Junior Boarder
- Posts: 25
- Joined: Thu Jul 10, 2008 4:26 pm
Re:How can the background color of graphs be changed?
That´s right, the command is overriding some settings. I forgot to give you the complete command line:
set terminal png <backgr> <border> <axes> <curve1> <curve2> <fontsize>;set mxtics 6;set locale "de_DE";
Sometimes it´s neccessary to set the number of the vertical lines (tics) to adjust the x-axis (command: set mxtics <number> ).
Gruss
Jürgen
set terminal png <backgr> <border> <axes> <curve1> <curve2> <fontsize>;set mxtics 6;set locale "de_DE";
Sometimes it´s neccessary to set the number of the vertical lines (tics) to adjust the x-axis (command: set mxtics <number> ).
Gruss
Jürgen
Re:How can the background color of graphs be changed?
Hi Jürgen,juergen_h. wrote:That´s right, the command is overriding some settings. I forgot to give you the complete command line:
set terminal png <backgr> <border> <axes> <curve1> <curve2> <fontsize>;set mxtics 6;set locale "de_DE";
Sometimes it´s neccessary to set the number of the vertical lines (tics) to adjust the x-axis (command: set mxtics <number> ).
Gruss
Jürgen
good stuff, that works in bringing some Farben into the graphs!
BTW: Due to the manual an option for <backgr> is transparent.
There´s one thing though that doesn´t seem to work.
Could it be that the
set terminal png command and the
set style line 1 lw 3|set style line 2 lw 3|set style line 3 lw 2|set style increment user command
do not work together?
With one line it works, but not with two or more.
Because when using the set terminal command the set style line is ignored.
Boris, is there a chance to implement something that gives a choice drawing a graph completely with gnuplot commands instead of meteohubs GUI.
I´m thinking of something within the graphs GUI, if enabled only manually entered commands will create the graph output.
If possible I want to have this graph
http://wetterstation-buch.de/temperatur.htm
changed into the bgcolor of the website and preserved the different thickness of lines as well.
Danke,
Wolfgang

Re:How can the background color of graphs be changed?
Hi Guys
Reading with interest your points on the graphs. I would like to do the same plus also smooth off the graph reading in various graphs, i.e barometer. But and and a big "but", I can't get to grips with gnuplot software.:unsure:
Any chance of giving complete meteohub cmd lines, that I can insert into the cmd line in the edit graph section, or something that I can play around with.
One graph that I have a lot of trouble with is the Wind Direction 360 deg format.
So any help would be appreciated.
alan
Re:How can the background color of graphs be changed?
Alan,
The easiest way I have found to smooth out graphs such as barometer is to use a larger bucket for time periods. 5 minute buckets gives a very jagged line for any graph, but the 10 minute bucket looks much nicer for a one-week graph.
I doubt GNUplot has any internal algorithms to smooth graphs, since the program is only designed to take external data and plot it out, not to render or further process that data. Smoothing would have to be done with an additional, pre-processing program (and if you think about it, averaging the data into buckets is a very basic type of smoothing!)
Re:How can the background color of graphs be changed?
Hi
Thanks for the informative reply, left hand and right hand syndrome. I had not really thought that it was the time span that was giving me the readings that I did not want.
Maybe my perception of weather data gathering is all wrong, I am no doubt trying to cram too much data into meteohub and wanting to see too much myself, (as you see the rain fall or pressure change, I want that data to be available to me)...wrong:silly:
I will change a few things and see how I go on.
Re:How can the background color of graphs be changed?
Hi,
it seems gnuplot already comes with a feature allowing to smooth curves (see below)
Though the plot command is controlled by meteohub it isn´t applicable right now.
As I said:
I was thankful if Boris could implement a feature in future releases allowing full manual control for creating graphs in meteohub. That would give full freedom in integrating meteohub graphs into any website design.
Cheers,
__
from: http://t16web.lanl.gov/Kawano/gnuplot/plot2-e.html#5.8
I want to connect all points with some smooth curves.
Gnuplot has a provision for data smoothing with the cubic-splines or the Bezier curves. To display the smoothed curve, use the smooth option in the plot command. There is a difference between those smoothing methods. The spline function is an interpolation between the data points, while the Bezier curve is an approximation of the data trend.
The following example is a comparison of the spline function and the Bezier curves. The same data are plotted in the three ways, the original data which are shown by the symbols, the curve smoothly interpolated with the spline function, and the Bezier curve.
Re:How can the background color of graphs be changed?
Hi
Thanks for your reply. Yes this would makes things easier all round, but I suppose we have to remember all the other jobs that Boris has to do for us. I am sure with time, that's if nobody else cracks it first.
One of the major problems that I have is understanding all the code and jargon that goes with it. I am a patient man and am approaching retirement, so will have more time to try and understand it all.
Thanks once again.
alan
PS:-Not Found
The requested URL /Kawano/gnuplot/plot2-e was not found on this server.
PPS: ah ah not all of your link was the same colour, fooled me for a moment.
Re:How can the background color of graphs be changed?
I did nothing wrong, only used the pre-defined tags from the menu:binbags wrote: PS:-Not Found
The requested URL /Kawano/gnuplot/plot2-e was not found on this server.
PPS: ah ah not all of your link was the same colour, fooled me for a moment.
A strange bug in Joomla and/or FireBoard it seems :laugh:
another case for Boris ;)
if he got time ...
---
I fixed it myself in using addtional tagging the address with
Code: Select all
[url][/url]