Update:
meanwhile the lightning sensors have (following some logics unexplainable to me) re-appeared again in the view of the history database (history tab) - and even in the history view of the live data tab. I had a few reboots (without updates as the SW is already on the latest version 4.4) and somehow they are back again.
Still I am not happy with the depiction and still think that the display of the recording is faulty and data is missing (at least not visible in the web interface).
-
Lightning total should show the number of days when lightening occurred/was recorded - this is
not the case right now (see pictures)
-
Lightning energy should be renamed to Lightning strikes or Lightning occur. (occurrences per day) - this sensor seems to be recorded partially correctly (OK in live data tab - NOT OK in history tab)
-
Lightening distance: OK in live data tab, NOT OK in history tab)
a few examples below for each of the sensors in the history tab
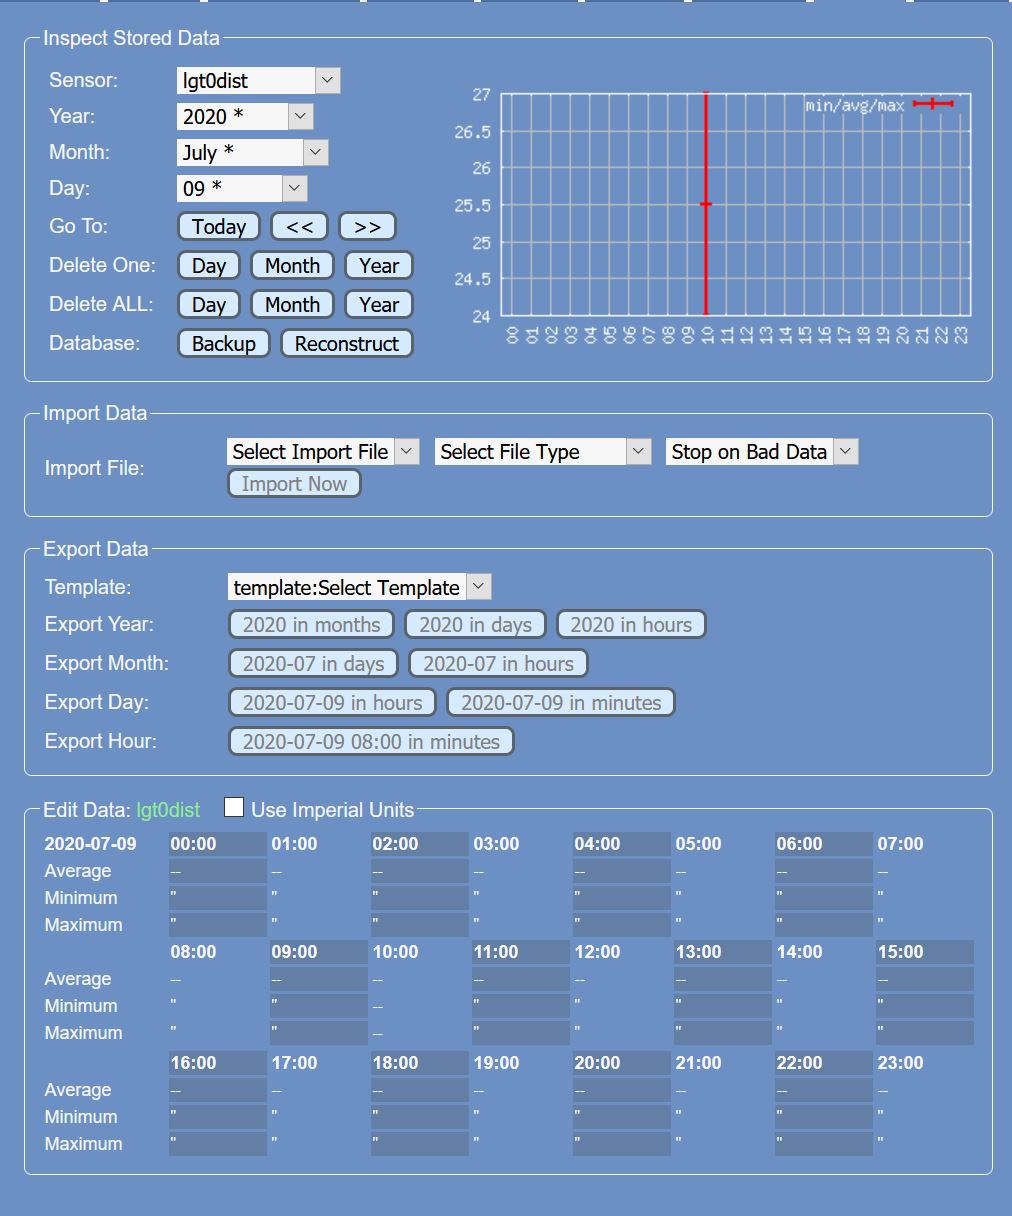
- MB-lgt0dist-20200709.JPG (155.14 KiB) Viewed 1177 times
only the graph shows data - nothing is shown in the hourly table where per hour window the min and max values should show
the information from the graph should be transferred to the table view
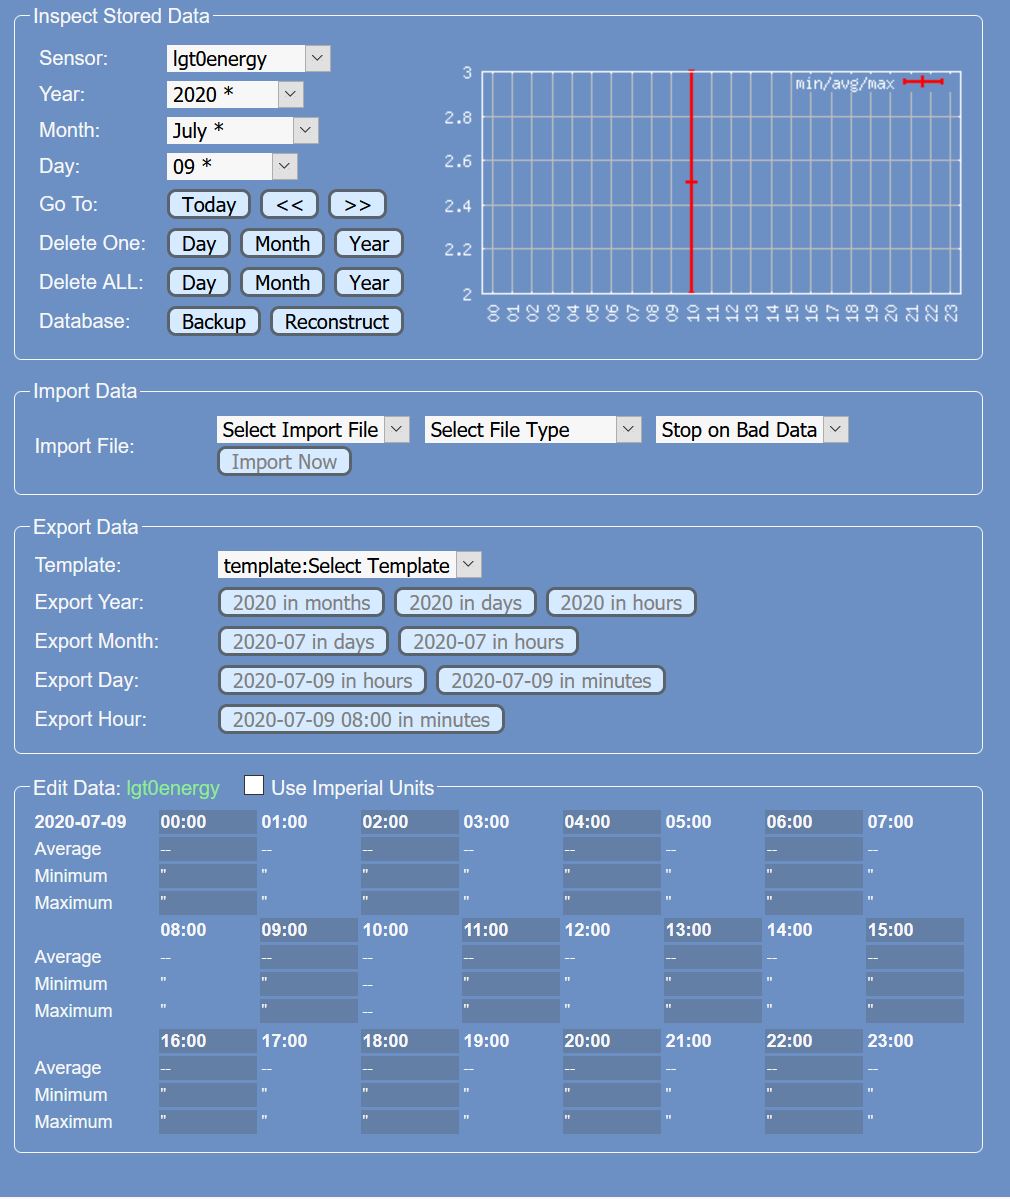
- MB-lgt0energy-20200709.JPG (154.79 KiB) Viewed 1177 times
the information from the graph should be transferred to the table view
however an average doesn't make sense here in my opinion (in the example 2.5 is wrong for 3 strikes, it should be min=max=average=3)
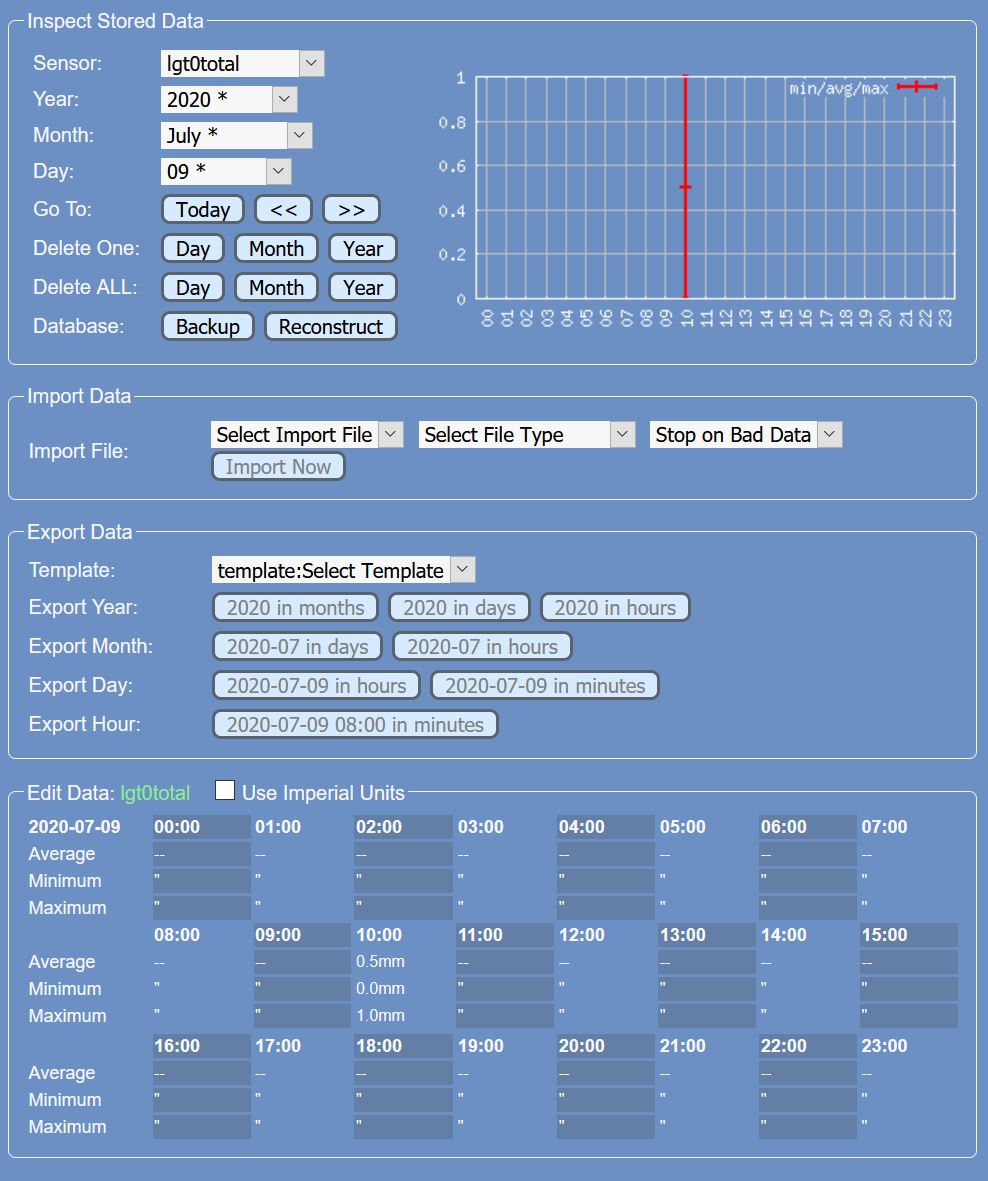
- MB-lgt0total-20200709.JPG (151.84 KiB) Viewed 1177 times
daily values can only 0 or 1, maybe shown as it does at the time of the first occurrence
HOWEVER when the monthly and yearly totals are created, they should be added which is obviously not done
- MB-faulty-lightning_20200724_exc.jpg (203.13 KiB) Viewed 1177 times
also it seems to have "forgotten" the strike 14 km distance (see picture 2 of the original post under the green arrow)
The live data look OK
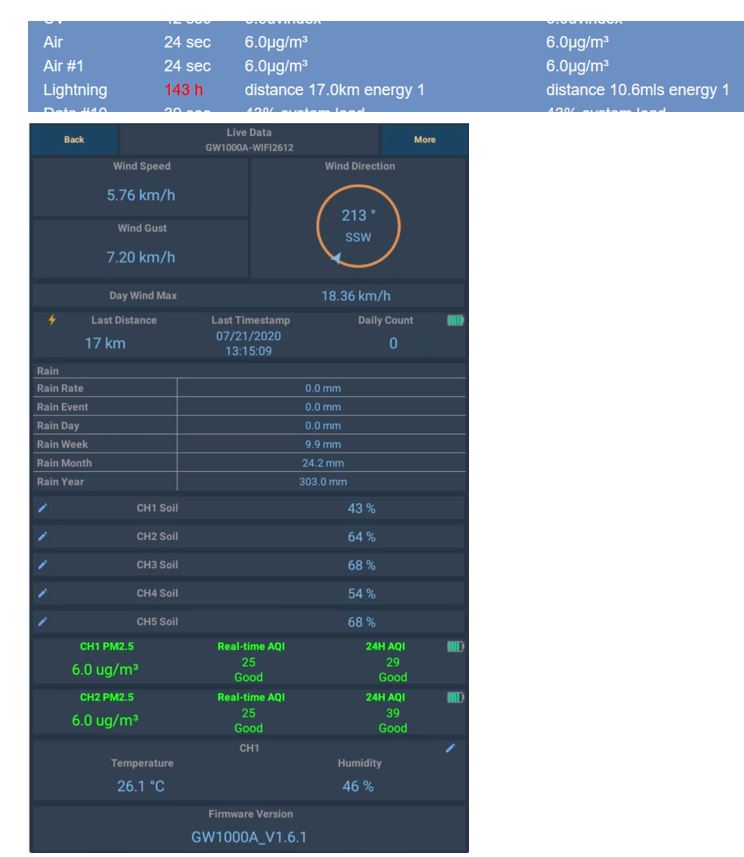
- MB+WS View Live data_20200727_1239 CEST.JPG (58.65 KiB) Viewed 1176 times
Anybody of the readers have similar observations ?

