Hi,
I'm a little bit confused about some of my graph definitions... or lets say I'm confused about the results...
First, this one http://www.porquesi.de/wetter/7days_out_rain.png
It should show the rain of the last 7 days. But it does not show the rain for the current day, even if it already rained earlier today (upload schedule is "Every Hour" ), it shows nothing, only the rain for the previous days 2-7. Even if data aggregation is "1 day" it should give the data for today, shouldn't it? But it takes until tomorrow, then it shows correctly the rainfall of today :huh:
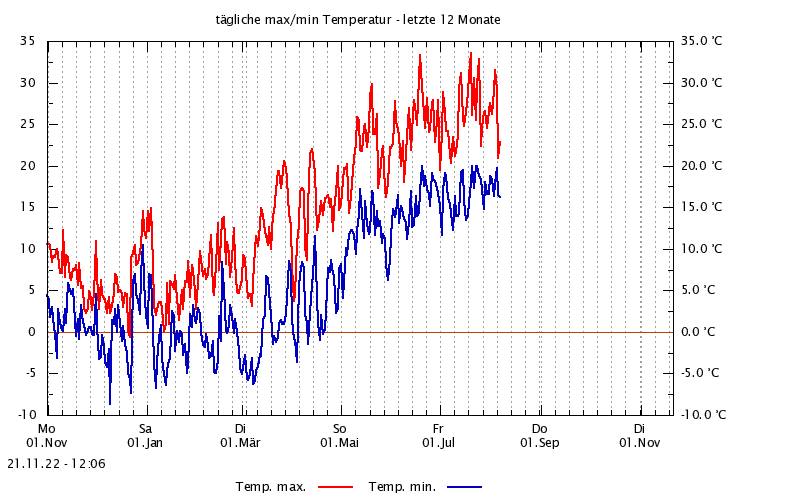
Then this one here http://www.porquesi.de/wetter/last3monthsmaxmintemp.png
It should show the max/min temp of the previous 5 months, which it does perfectly. Only yesterday is missing, even if the graph has been created at 00:20 today (upload is schedule is "Everyday" )
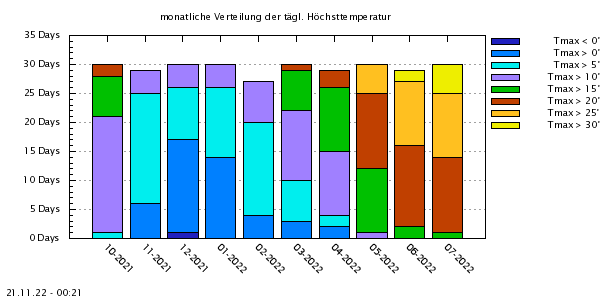
And las but not least this one: http://www.porquesi.de/wetter/tempdistryearly.png
The timeframe is set to the current year. But even if there is already data available for the first days of May, it takes until June to show the data for May :blink:
...do I miss something obvious here? Or do I need to setup schedule and timeframe differently?
Confused about some graph definitions
Moderator: Mattk


Re:Confused about some graph definitions
Data computation in Meteohub is organized in a way that at the end of each time period (selected as time resolution in the graph) the data gets computed. If you are in a daily mode, you will not see data for current day. That has to do with basic computation principles in Meteohub, where no recomputation of data is triggered each time some new raw data is tapping in.
The client/server Meteoplug offering is doing that in another way. Here, each time a set of data gets uploaded all computations are done immediately. So Meteoplug graphs will even show data for time buckets not finished yet. I specially designed it this way for Meteoplug, to avoid irritations that you suffer with Meteohub.
The client/server Meteoplug offering is doing that in another way. Here, each time a set of data gets uploaded all computations are done immediately. So Meteoplug graphs will even show data for time buckets not finished yet. I specially designed it this way for Meteoplug, to avoid irritations that you suffer with Meteohub.
-
nduku

- Senior Boarder

- Posts: 45
- Joined: Sun Jan 03, 2010 8:07 pm
- Location: Eberfing, Bavaria/Germany
- Contact:
Re:Confused about some graph definitions
Ok, that makes sense. Maybe I will change my mind and have a look at Meteoplug, so far I was able to resist, but I wouldn't count on that for too long ;)
One additional question to this though. The second one I mentioned: http://www.porquesi.de/wetter/last3monthsmaxmintemp.png
For this one, not only today is missing, but the previous day also. As the schedule is set to "Everyday", Meteohub generates the picture around 00:20. But it seems, that the computation including the previous day is not yet finished at that time. Is that possible?
Re:Confused about some graph definitions
yes, Meteohub computes data on fixed schedules. So it can easily be that computation is not fixed 20 mins past midnight.