Page 2 of 2
Re: Meteobridge PRO can now generate interactive graphs
Posted: Sat Oct 22, 2016 11:43 am
by admin
DAP wrote:Very nice.
Feature request: I have a 4K monitor, and while the graph autoscales to the width of the screen, it only fits in the top third of the display. Please have it autoscale vertically as well as horizontally.
You can make a copy of the chart definition "allinone-imp.chart" in MB PRO network folder "templates" and change this line
to
in order to have it twice as high.
Re: Meteobridge PRO can now generate interactive graphs
Posted: Sat Oct 22, 2016 3:09 pm
by cphMichael
Thank you for the new Graphs

My Station is a Davis Vantage VUE, so I have no Solar or UV sensor.
Therefore the Solar/UV graph is empty.
Is it possible to ‘disable’ the Radiation chart?
/Michael
Re: Meteobridge PRO can now generate interactive graphs
Posted: Sun Oct 23, 2016 6:03 pm
by admin
it should suppress radiation data when no sensors there. I will check this.
Re: Meteobridge PRO can now generate interactive graphs
Posted: Sun Oct 23, 2016 6:55 pm
by cphMichael
Unfortunately, It doesn't suppress radiation data.
You are welcome to take a look here:
http://frederiksberg-vejret.dk/ChartTodayMin.php
I rebooted the Meteobridge to upgrade to "released October 23, 2016" but it's still says "Meteobridge 3.1 (Oct 20 2016, build 10630), FW 1.4"
/Michael
Re: Meteobridge PRO can now generate interactive graphs
Posted: Mon Oct 24, 2016 4:03 pm
by admin
Just release update should handle non-existence of solar/uv sensors correctly and we have new chart types showing min/max values, which might be particular helpful for daily/monthly views.
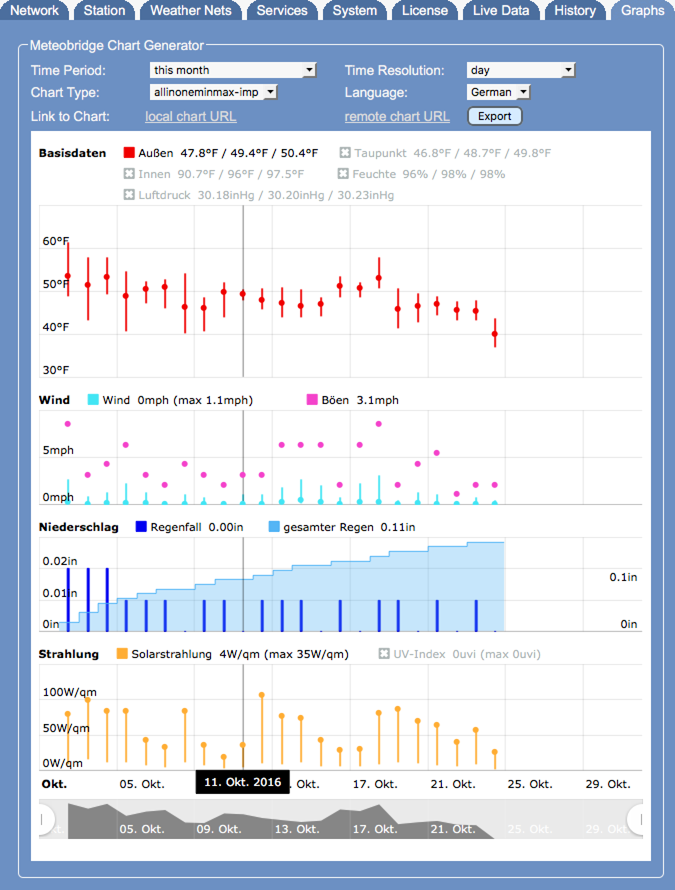
- chart-x.png (120.04 KiB) Viewed 8450 times
Re: Meteobridge PRO can now generate interactive graphs
Posted: Tue Oct 25, 2016 10:11 pm
by Mattk
October 24 release appears to have lost the IE support, back to spinning spokes again, all good in Chrome.
Re: Meteobridge PRO can now generate interactive graphs
Posted: Mon Oct 31, 2016 12:47 am
by admin
Todays release fixes a bug related to daylight saving time switches and adds a new graph type, called heatmap.
Heatmaps show each day in a column, with the hours stacked in the vertical and showing temperatures by colors.
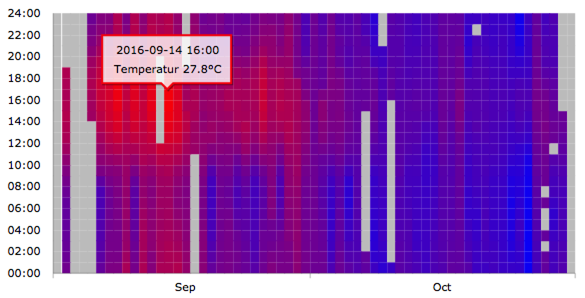
- heatmap.png (63.34 KiB) Viewed 8400 times
Re: Meteobridge PRO can now generate interactive graphs
Posted: Mon Oct 31, 2016 4:13 pm
by cphMichael
Hi Boris,
Could you be interested in making an Interactive Graph that show “Weather Trends” like the one that the Saratoga scripts does – but made with JavaScript in the same nice way as your ‘allinone’ do?

Michael
Re: Meteobridge PRO can now generate interactive graphs
Posted: Sat Nov 05, 2016 8:14 am
by marco
Very nice work, congrats Boris and thanks a lot ...keep coding..!

Re: Meteobridge PRO can now generate interactive graphs
Posted: Mon Nov 14, 2016 11:46 am
by jay
webcam wrote:Would be nice if you could change wind at km/h.
... also temperature in celsius instead of fahrenheit for those using metric measurements.
Re: Meteobridge PRO can now generate interactive graphs
Posted: Mon Nov 14, 2016 7:56 pm
by admin
Meteobridge PRO graphing templates always come in two flavours:
"iso" with kmh/mm/hPa/°C and "imp" with mph/in/inHg/°F.
Re: Meteobridge PRO can now generate interactive graphs
Posted: Sat Nov 19, 2016 11:53 am
by marco
admin wrote:(to be found on "amcharts.com" where you can also see lots of examples what this package can deliver) then you can adapt/design your own graphs. I know that just a fraction of users will do that, but the results of those can be share with the whole Meteobridge PRO community.
Hi
i have two question about the graphing stuff.
First question:
Are all demos from amcharts implemented to use them in MB-Pro, ? Also the gauges and other stuff? There seems to be 3 packages on the amchart-website:
1. JavaScript Charts
2. JavaScriptStock Charts
3. JavaScript Maps
second question:
changing the theme from light to dark, possible?
i tried to change this two lines (Nr.40 and nr.70) in the "tempminmax-iso-file" in the template-folder from the MB-Pro:
(Line number 40)
from:
#METEOBRIDGE#inline /www/public/amcharts/light.js to -->
#METEOBRIDGE#inline /www/public/amcharts/dark.js
(Line number 70)
From:
"theme": "light", -->
"theme": "dark",
after that the graph should be kind of dark, if i'm right? but nothing has changed on my side ^^

Thanks for your support!
marco
Re: Meteobridge PRO can now generate interactive graphs
Posted: Sat Nov 19, 2016 12:22 pm
by admin
We have licensed "charts" and "stock charts", not the "maps".
I would also expect the dark theme to work, but did not test this. Please keep in mind that
the original chart template files will be restored to original content on each reboot,
so please give your new definitions a unique name.
Re: Meteobridge PRO can now generate interactive graphs
Posted: Sat Nov 19, 2016 1:07 pm
by admin
Changing theme to "dark" works on my rig, but you have to change background of the div "chartdiv" also to a dark grey.
That can be done after these lines:
Code: Select all
ctx.putImageData(imgData, 0, 0);
var lb = new $.LoadingBox({loadingImageSrc: canvas.toDataURL()});
by adding this line:
Code: Select all
setTimeout (function(){ document.getElementById('chartdiv').style.background = '#202020';}, 600);
Re: Meteobridge PRO can now generate interactive graphs
Posted: Sun Nov 20, 2016 9:49 am
by marco
Hi
yep that works fine... thank you!
marco