This is now working.
Here is some verified working example code that gathers data from a website/server http request and stores the results. This example was air quality data:
Code: Select all
#!/bin/sh
#
while true;
do
  aqi25=$(wget -qO- http://10.10.10.202/aqi25.data)
  echo "air1 $aqi25"
  aqi10=$(wget -qO- http://10.10.10.202/aqi10.data)
  echo "air2 $aqi10"
  sleep 300
done
For preference use an editor that does not put CR/LF (carriage return, line feed) on the end of each line. If forgotten it will be removed when the script (called: <yourscript>.plugin) is used.
The primary weather sensor uses th
0temp, th
0dew, etc. If your user defined sensor/plugin is the first additional weather sensor then values will be th
1temp, th
1dew, etc. In the case of air quality where there are three values to store, the Meteobridge will report them as air
1!0pm, air
1!1pm and air
1!2pm (for PM1.0, PM2.5 and PM10 respectively. The "
1" in this case represented that it was the first additional sensor.
You will be able to see the data in the Raw Sensor Data of the meteobridge. It will also be available in history. However, you'll have to create your own chart template if you want to chart the data.
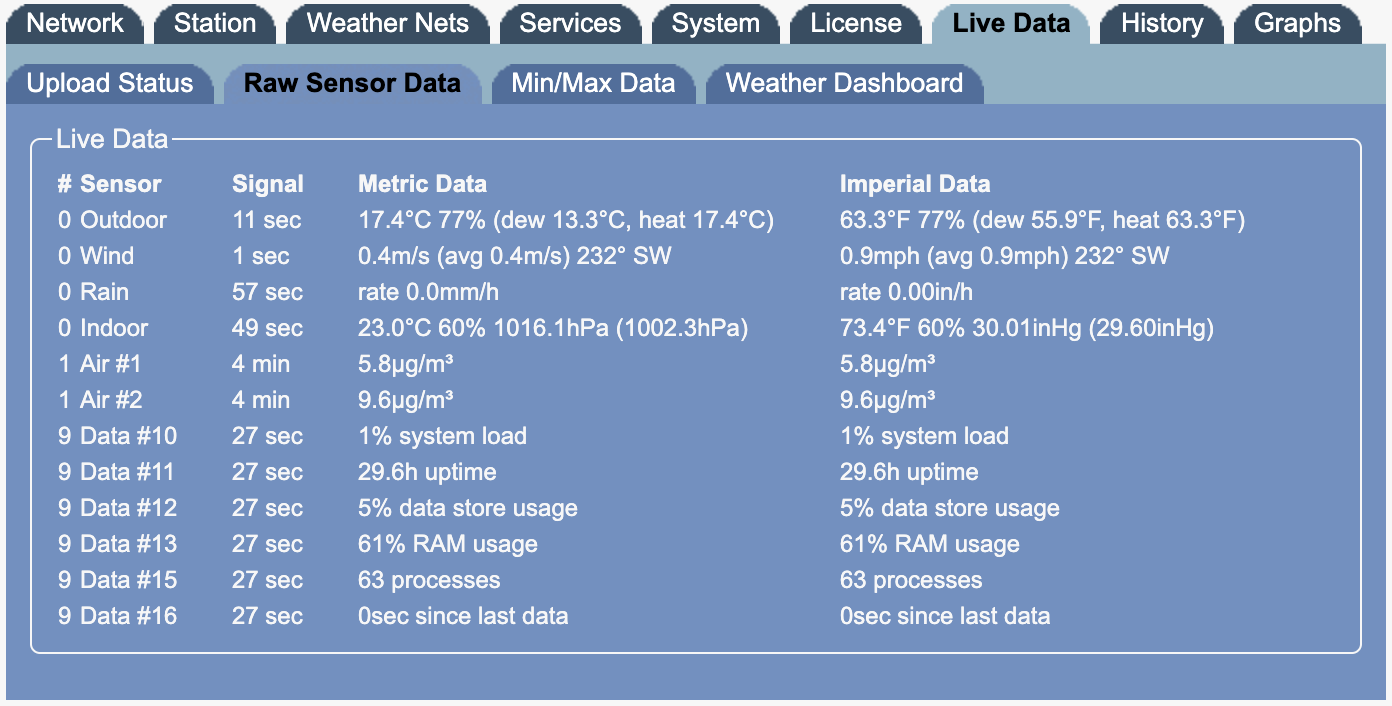
- Screenshot 2020-09-21 at 21 September 2020 20.19.08 pm.png (188.06 KiB) Viewed 1319 times