Page 1 of 1
Bug in Precipitation Graphic. **solved**
Posted: Sun Jul 25, 2021 6:47 pm
by Neco
Hi
There seems to be a bug in the latest update: In all charts the line for accumulated precip is too long and does not stop at the same time as the other parameters. See attached image:
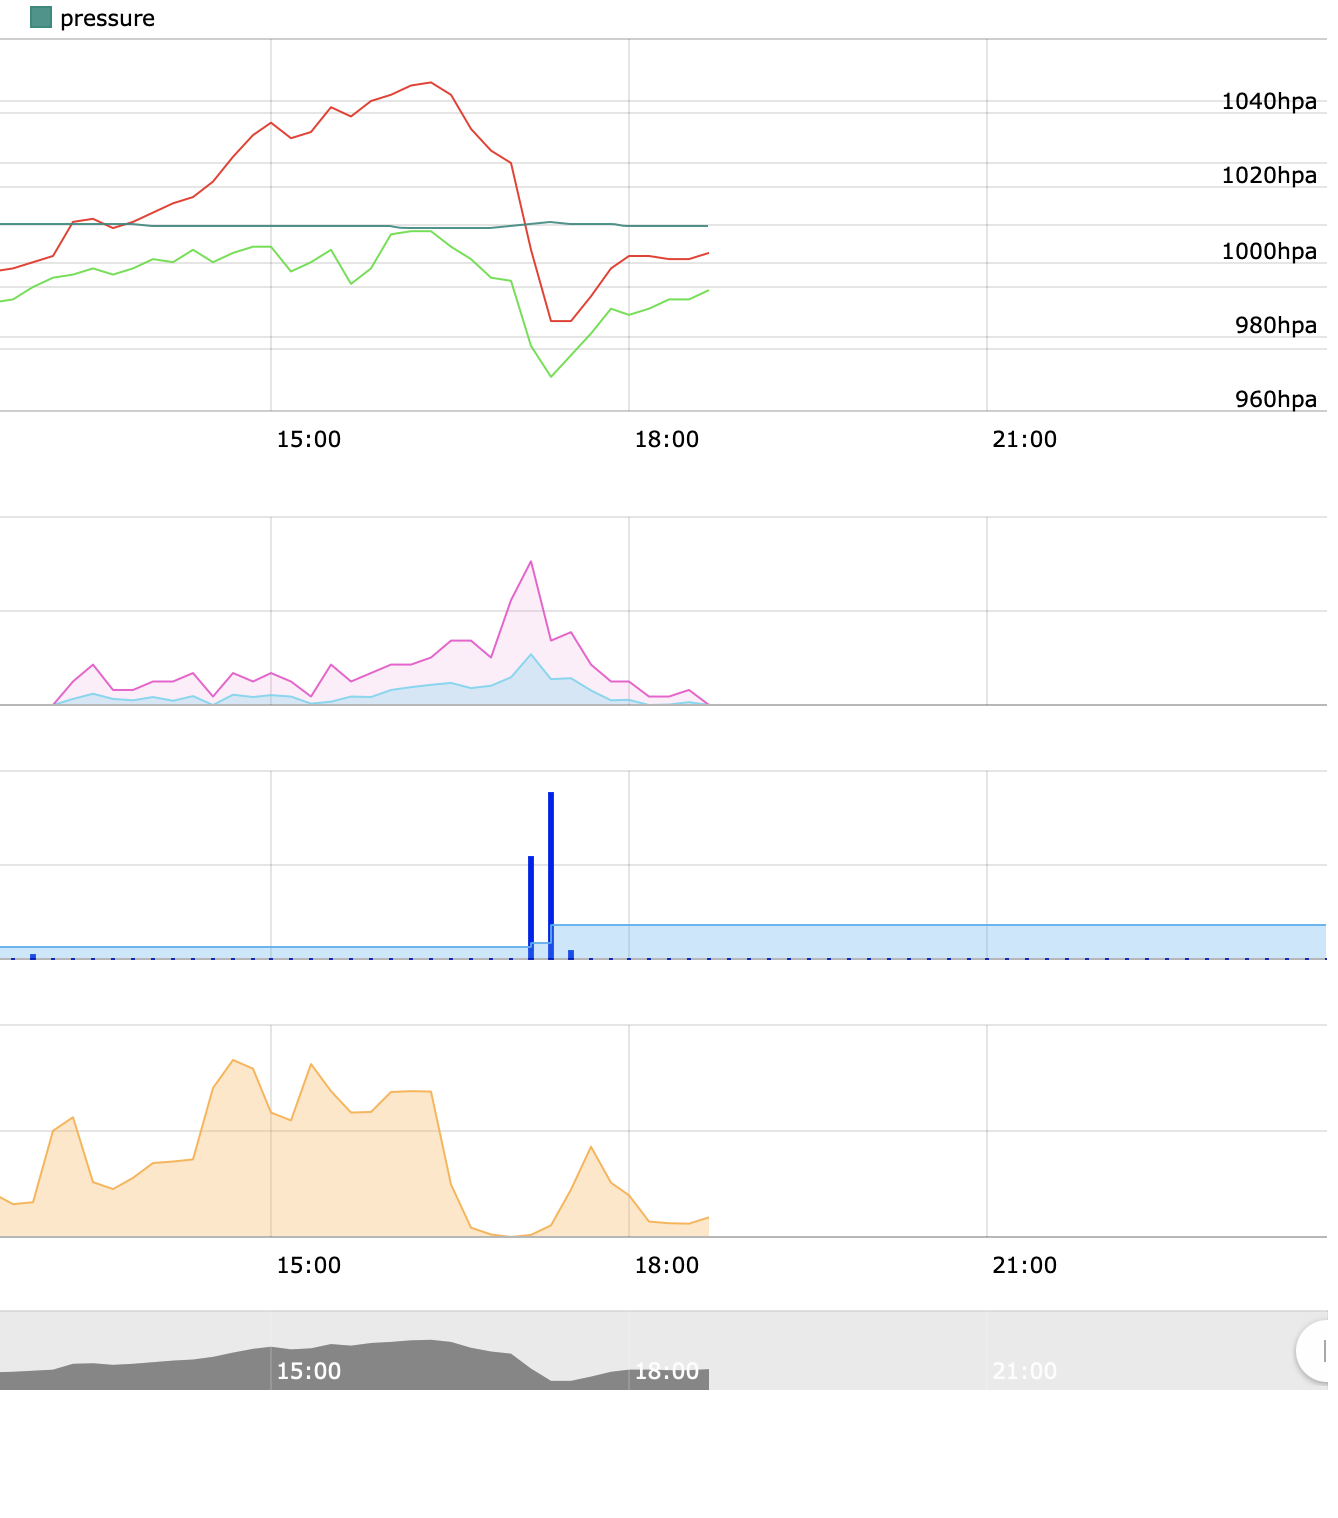
- Bildschirmfoto 2021-07-25 um 18.45.25.png (145.93 KiB) Viewed 2422 times
Re: Bug in Precipitation Graphic
Posted: Thu Jul 29, 2021 9:17 am
by admin
Should be fixed with newest update.
Re: Bug in Precipitation Graphic
Posted: Fri Jul 30, 2021 3:55 pm
by Neco
admin wrote: Thu Jul 29, 2021 9:17 am
Should be fixed with newest update.
Seems to be fixed with all the "predefined" charts, however, I still have this bug in the self-defined graphs
Re: Bug in Precipitation Graphic
Posted: Sat Aug 07, 2021 11:41 am
by admin
Can you please post the definition of a self-defined graph, that is impacted by this?
Re: Bug in Precipitation Graphic
Posted: Sun Aug 08, 2021 6:57 am
by paul_1055
I think Neco meant this problem.
With a resolution of 1 minute everything is OK
https://admin.meteobridge.com/91ee98fbb ... 2108080030
With a resolution of 5 minutes, I only have a rain total for the day of 1.6mm
https://admin.meteobridge.com/91ee98fbb ... 2108080030
But for me this is the case with all cumulative sensors
Code: Select all
# generated by meteobridge version 5.2
# date: 2021-07-24 16:50
#
width 100%
height 480px
fgcolor #000000
bgcolor #ffffff
legend 1
type0 line
futuredata yes
title1 Regen
height1 70%
datetime1 no
height2 30%
type1 line
unit1 mm
color1 #0000ff
fill1 0.0
min1 0
axis1 left
active1 yes
panel1 1
name1 Regen/min
type2 step
unit2 mm/h
color2 #046dbb
fill2 0.5
min2 0
axis2 right
active2 yes
panel2 1
name2 Regenrate
type3 line
unit3 mm
color3 #0dbef9
fill3 0.1
min3 0
axis3 left
active3 yes
panel3 2
name3 Regen Σ/Tag
data1 rain0total-sum=mm1,00+0,00.1
data2 rain0rate-max=mmh1,00+0,00.1
data3 rain0total-daysum=mm1,00+0,00.1
Re: Bug in Precipitation Graphic
Posted: Sun Aug 08, 2021 12:44 pm
by admin
First, I think there is a slight misconception in your example. "rain0total" is the amount of rainfall in a given time period. In your example you name "rain0total" as "Regen/min". IMHO this is wrong as it is the total in a time frame that is defined when calling the graph. It can be 1min, 5min, 1hour, etc. I would call it "Regenmenge".
Putting that aside it is indeed strange that "rain0total-daysum" does show differences if you take per minute or 5 minute resolution. I inspected this in more detail and found a bug in the code. Please give just released version a try.
Does this also fix the bug mentioned in the beginning of this thread?
Re: Bug in Precipitation Graphic
Posted: Sun Aug 08, 2021 1:21 pm
by admin
Just released update should also stop dailysum evaluation when no new data there.
Re: Bug in Precipitation Graphic
Posted: Sun Aug 08, 2021 3:32 pm
by paul_1055
Yes, the name was a bit unfortunate. Thanks for the correction
The evaluation of "rain0total" works correctly after the update.