
http://www.wetter-keppeln.de/sommertage.html
Data Source
The script is based on text files that contain daily temperature data (maximum and minimum temperature). These files are automatically generated once per day by Meteobridge as a backup.
Example filename:
temp-2025-day
CSV Data Format
The data is stored in a CSV file with the following structure:
Code: Select all
# Standard CSV template with data in metric units
#
# Date, Time, Max Temperature [°C], Min Temperature [°C]
[YYYY]-[MM]-[DD],[hh]:[mm],[th0temp-max=C.1:],[th0temp-min=C.1:] The generated temperature data files must be located in the same directory as the PHP script (e.g., Sommertage.php).
The template for Meteobridge must be placed in the Templates folder.
Script Adjustments
If you prefer to use the minimum temperature instead of the maximum temperature for the chart, you need to modify the following line (line 38) in the PHP script:
Original (uses maximum temperature):
Code: Select all
$temperatur = floatval(trim($teile[2]));Code: Select all
$temperatur = floatval(trim($teile[3]));Questions & Notes
This script was created with the help of AI, and I am not an expert in PHP, so any suggestions for improvement are welcome! Feel free to ask if you have any questions.
Here is the PHP code for the diagram
Code: Select all
<?php
$verzeichnis = '.'; // Directory containing the yearly data files
$SommerTage = []; // Array to count summer days per year
$jahre = [];
// 1) Iterate through all matching .txt files in the directory
foreach (glob("$verzeichnis/temp-*-day.txt") as $datei) {
// 2) Extract the year from the filename (e.g., temp-2023-day.txt -> 2023)
if (preg_match('/temp-(\d{4})-day\.txt/', basename($datei), $matches)) {
$jahr = $matches[1];
} else {
continue; // Skip if filename does not match
}
// Mark the year to ensure it exists in the result
$jahre[$jahr] = true;
// 3) Load the file into an array of lines
$daten = file($datei, FILE_IGNORE_NEW_LINES | FILE_SKIP_EMPTY_LINES);
// Initialize counter if not set
if (!isset($SommerTage[$jahr])) {
$SommerTage[$jahr] = 0;
}
// 4) Iterate through each line
foreach ($daten as $zeile) {
$teile = explode(',', $zeile);
// Expecting 4 values: date, time, temp_max, temp_min
if (count($teile) < 4) {
continue; // Skip invalid lines
}
// The temperature to evaluate is in column 3 (index 2)
$temperatur = floatval(trim($teile[2]));
// Check if it's a summer day
if ($temperatur >= 25) {
$SommerTage[$jahr]++;
}
}
}
// 5) Ensure years without summer days are included
foreach ($jahre as $jahr => $_) {
if (!isset($SommerTage[$jahr])) {
$SommerTage[$jahr] = 0;
}
}
// 6) Sort by year
ksort($SommerTage);
// Convert to JSON for Chart.js
$jahreJson = json_encode(array_keys($SommerTage));
$werteJson = json_encode(array_values($SommerTage));
?>
<!DOCTYPE html>
<html lang="de">
<head>
<meta charset="UTF-8">
<meta name="viewport" content="width=device-width, initial-scale=1.0">
<title>Summer Days per Year</title>
<script src="https://cdn.jsdelivr.net/npm/chart.js"></script>
<style>
body { font-family: Arial, sans-serif; text-align: center; }
canvas { width: 100% !important; max-width: 1600px; margin: auto; }
@media (max-width: 768px) {
canvas { height: 400px !important; }
}
</style>
</head>
<body>
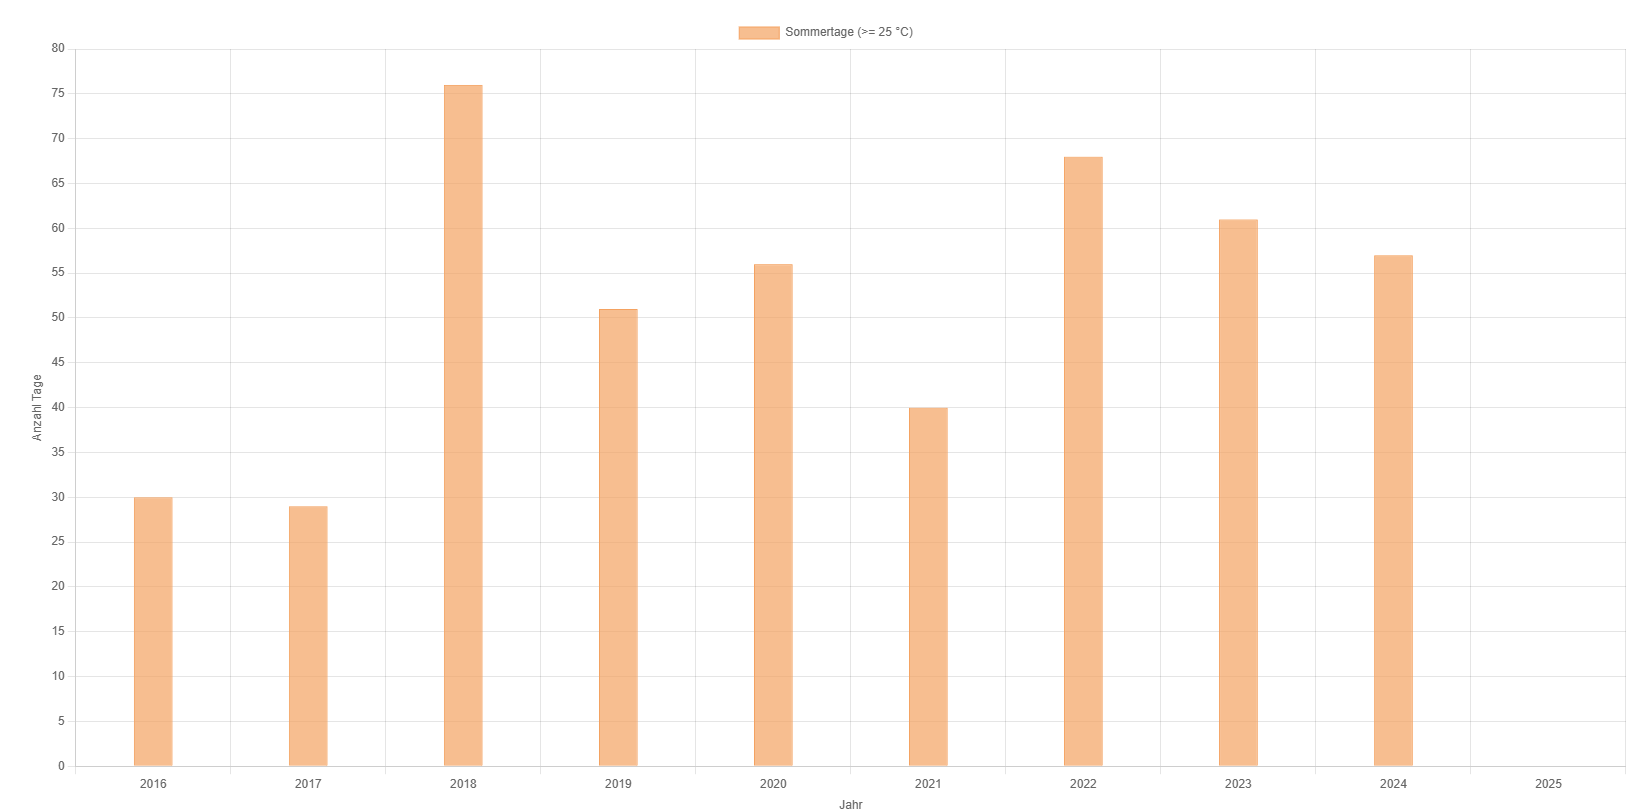
<h1>Summer Days (>= 25°C) Per Year</h1>
<canvas id="barChart"></canvas>
<script>
// Labels (years) and values (number of summer days)
const labels = <?php echo $jahreJson; ?>;
const data = <?php echo $werteJson; ?>;
const ctx = document.getElementById('barChart').getContext('2d');
new Chart(ctx, {
type: 'bar',
data: {
labels: labels,
datasets: [{
label: 'Summer Days (>= 25 °C)',
data: data,
backgroundColor: 'rgba(244, 162, 97, 0.7)',
borderColor: 'rgba(244, 162, 97, 1)',
borderWidth: 1,
barPercentage: 0.5,
categoryPercentage: 0.5
}]
},
options: {
scales: {
x: {
type: 'category',
title: {
display: true,
text: 'Year'
}
},
y: {
beginAtZero: true,
title: {
display: true,
text: 'Number of Days'
},
ticks: {
stepSize: 5
}
}
}
}
});
</script>
</body>
</html>