
i only have a question about the way graphs are updated.
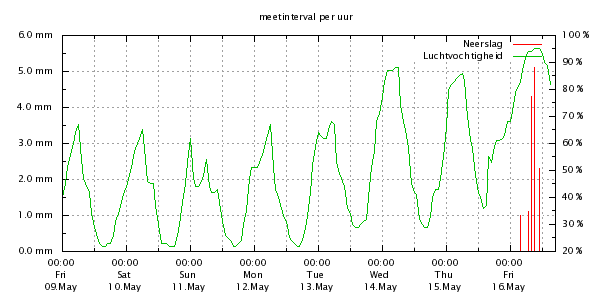
today it was the first day in 3 weeks that we got some rain here in the netherlands. this graph shows that perfectly (it displays the last week):
but then the graph showing the last 4 weeks (aggregation of 1 day) displays nothing yet:
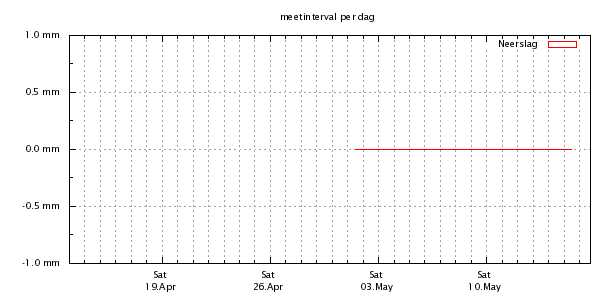
shouldn't that one display the total amount for this day already?
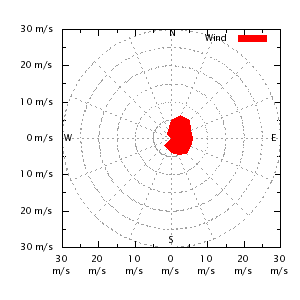
the same situation occurs in the wind-direction graphs:
last day
last 4 weeks
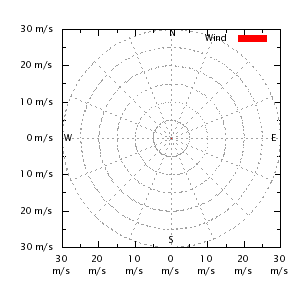
the aggregation for the last graph is set on 1 month, because i read somewhere on the forum here that that is the 'duration' of the data (in case of radar-graphs). but then again, nothing is display. should i wait till the month is over?
also when trying to make graphs for a full year using a fixed time frame i get this error:
the aggregation for this graph is also set to 1 month. do i have to wait a full month until this graph displays something? why doesn't it display all the data it has for this month already?plot - /srv/www/cgi-bin/goto.cgi th0-month1 20080101000000' using 1:2:3:4 axis x1y1 title \"Min/Max Buitentemperatuur\" with yerrorbars linecolor rgb \"#ff0000\" ^ \"/tmp/meteo0DBqQb\", line 33: warning: Skipping data file with no valid points plot - /srv/www/cgi-bin/goto.cgi th0-month1 20080101000000' using 1:2:3:4 axis x1y1 title \"Min/Max Buitentemperatuur\" with yerrorbars linecolor rgb \"#ff0000\" ^ \"/tmp/meteo0DBqQb\", line 33: all points y value undefined! Content-type: image/png
i'm a bit confused by this


